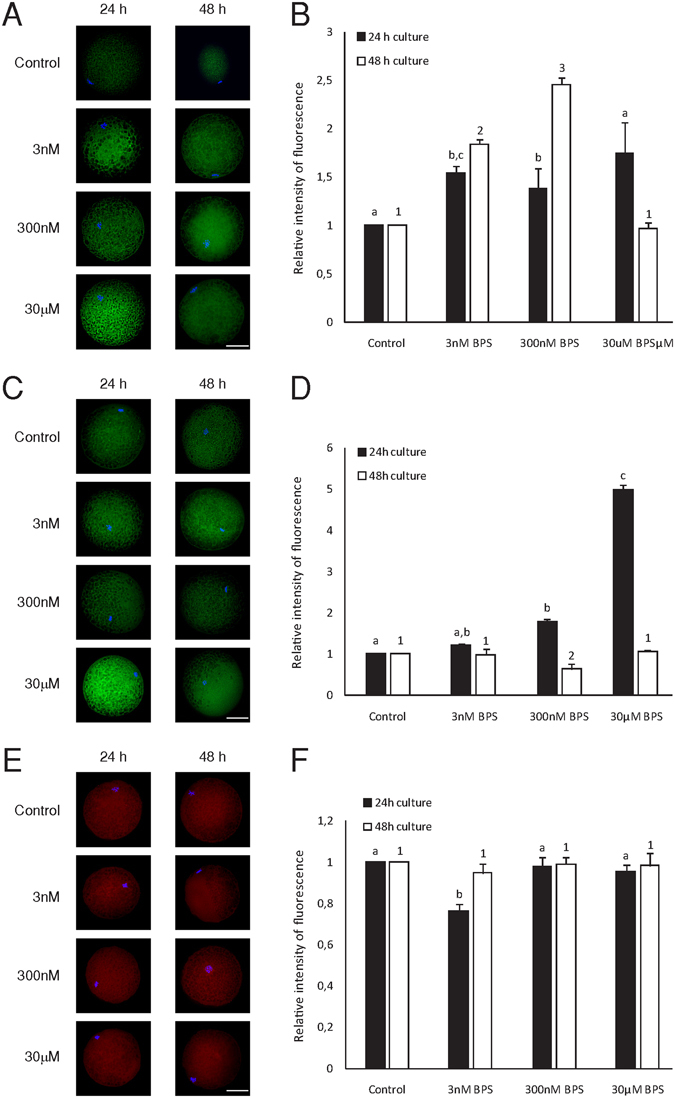
Figure 4.

Effects of BPS on ERα, ERα, and aromatase during oocyte maturation. Representative pictures showing changes in the distribution of ERα (A), ERβ (C), and aromatase (E) in oocytes cultured for 24 h and 48 h in vitro after BPS (3 nM, 300 nM, and 30 µM) treatment. Green colour indicates ERα and ERβ, red indicates aromatase, and blue indicates chromatin. Scale bar = 50 µM. Graphs (B), (D), and (F) represent differences in the relative fluorescence intensities of ERα, ERβ, and aromatase. The data are expressed as the mean ± SEM of three independent experiments in which at least 20 oocytes were analysed. Different superscript letters denote the statistical significance among experimental groups for 24 and 48 h of in vitro culture, respectively (P < 0.05).
