
Figure 5.
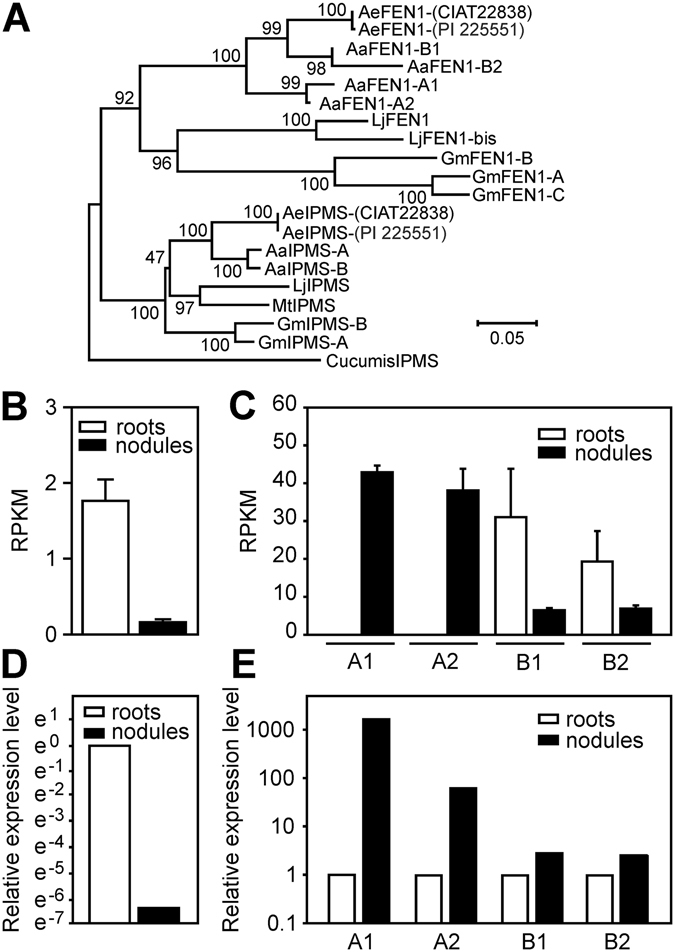
The Aeschynomene legumes A. evenia and A. afraspera contain FEN1 homoloques but only nodule specific expression is observed in A. afraspera plants. (A) Phylogenie based on FEN1 and isopropylmalate synthase (IPMS) sequences obtained from genomic and transcriptome databases of A. evenia (CIAT22838/PI 225551) and A. afraspera (LSTM #1). Cuccumis, Glycine max, Lotus japonicus and Medicago truncatula IPMS and FEN1 sequences were obtained from Genebank. -A, -A1, -B, -B1, bis and -C indicate different copies found in (polyploid) species. Cuccumis IPMS was used as outgroup. Numbers at nodes represent bootstrap values (% of 1000 replicates). (B) Transcript abundance reads (reads per kilobase per million; RPKM) of FEN1 in root and nodule tissue of A. evenia (PI 225551). (C) Transcript abundance reads (RPKM) of the different FEN1 homologues in root and nodule tissue of A. afraspera (LSTM #1) Error bars as shown in (B) and (C) indicate standard errors of the means of three biological replicates. (D) Relative FEN1 expression level in A. evenia (PI 225551) nodules elicited by Bradyrhizobium ORS285 at 8 dpi. (E) Relative expression level of the different FEN1 homoloques in A. afraspera (LSTM #1) nodules elicited by Bradyrhizobium ORS285 at 8 dpi. The relative expression level of the different FEN1 homologues as shown in (D), (E) was determined by RT-qPCR and normalized by the expression of Elongation Factor 1α. Non-inoculated roots were used as control.