
Figure 3.
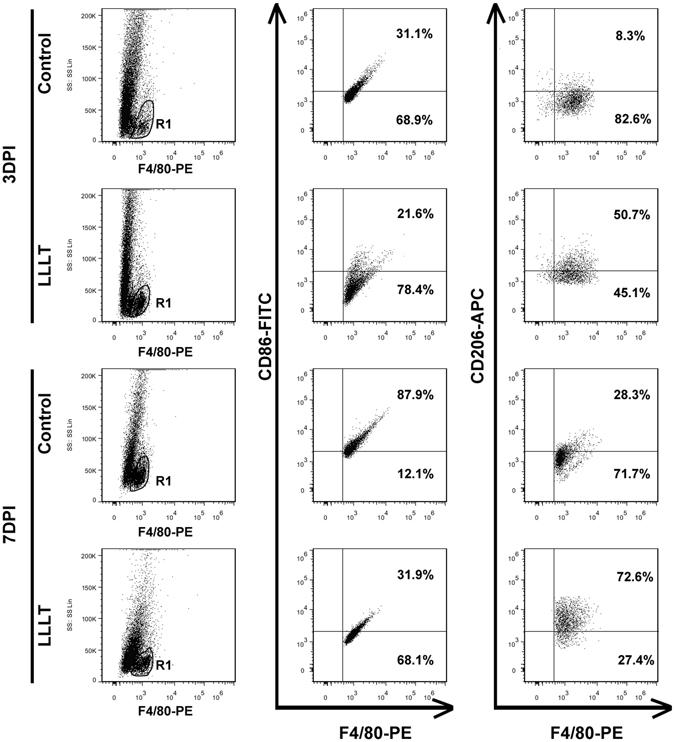
Dot plot of macrophage/microglia subpopulations. Representative dot plot of M1 and M2 subpopulations. R1 regions were gated as F4/80-positive populations. M1 cells were labelled with F4/80 and CD86, M2 cells were labelled with F4/80 and CD206. 3 dpi and 7 dpi refer to 3 and 7 days post-injury, respectively. SS, side scatter.