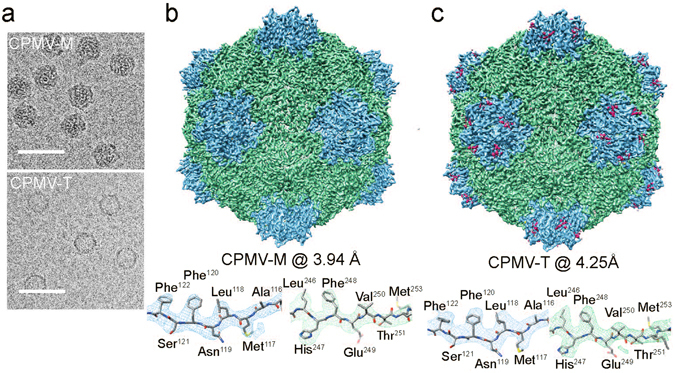
Figure 2.

Cryo-EM structure of CPMV-M and CPMV-T. (a) Electron micrographs of CPMV-M (top) and CPMV-T (bottom) to show particle distribution. Micrographs were imaged using a Titan Krios electron microscope and detected using a Falcon II direct electron detector (FEI). Scale bar in 50 nm. (b) EM density map of CPMV-M (CPMV particle containing RNA-2) determined by cryo-EM to a global resolution of 3.94 Å (EMD-3565). The Large (L) subunit is displayed in green and the Small (S) subunit shown in blue. The bottom panel shows an example of the EM density for an individual β strand from each the L and S subunits displayed as mesh representation. The atomic model within was refined against the EM density. (c) EM density map of the naturally occurring empty CPMV particles known as CPMV-T to 4.25 Å (EMD-3562). The view is identical to that shown in (b).
