Figure 3.

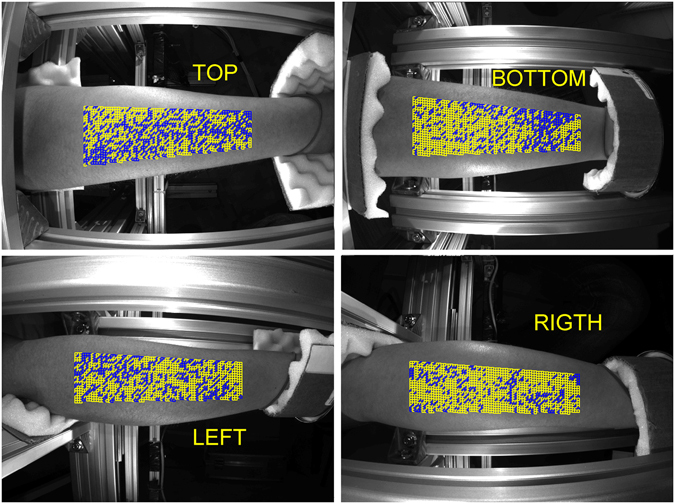
Spatial distribution of the good ROIs in four views of the forehand. Yellow and blue squares show positions of the ROIs with linear and distorted PPG waveforms, respectively.

Spatial distribution of the good ROIs in four views of the forehand. Yellow and blue squares show positions of the ROIs with linear and distorted PPG waveforms, respectively.