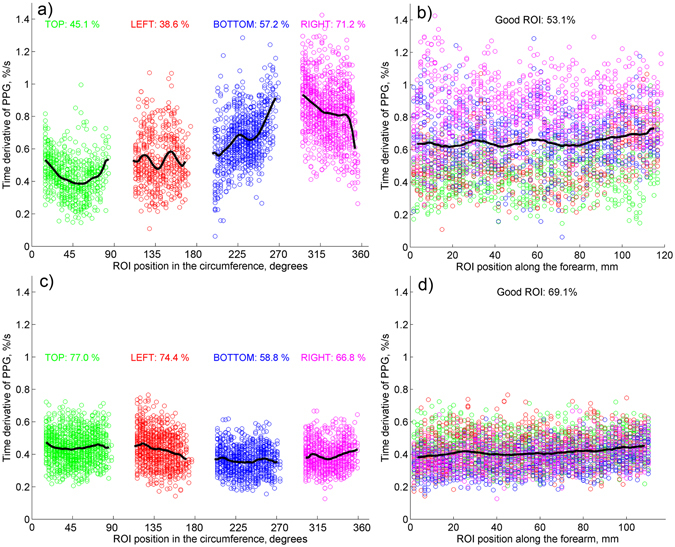
Figure 5.

PPG speed calculated for two subjects in “good” ROIs. (a) Data scatter as a function of the ROI position along the forearm’s circumference, and (b) along the longitudinal direction for one of the subjects. (c and d) are similar data scatter for another subject. Points measured in different views of the forearm are marked by green, red, blue, and magenta for top, left, bottom, and right cameras, respectively. Colored numbers show the percentage of the good ROIs in the respective view of the forearm.
