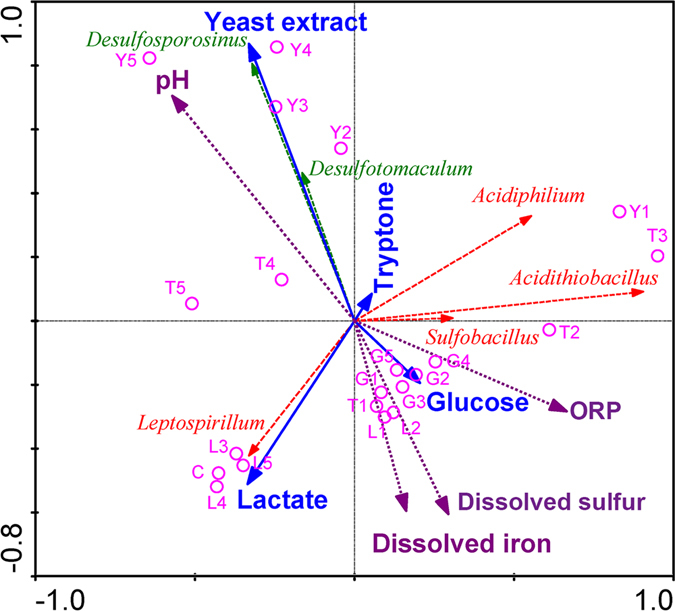
Figure 4.

Redundancy analysis. Redundancy analysis triplots show the relationships between the different nutrients, the microbial community and the physiochemical properties. Nutrients are shown with solid lines and solid arrows; experiments with different nutrients and concentrations are shown with empty circles; microbes are shown with dashed lines; physiochemical properties are shown with dotted lines and solid arrows.
