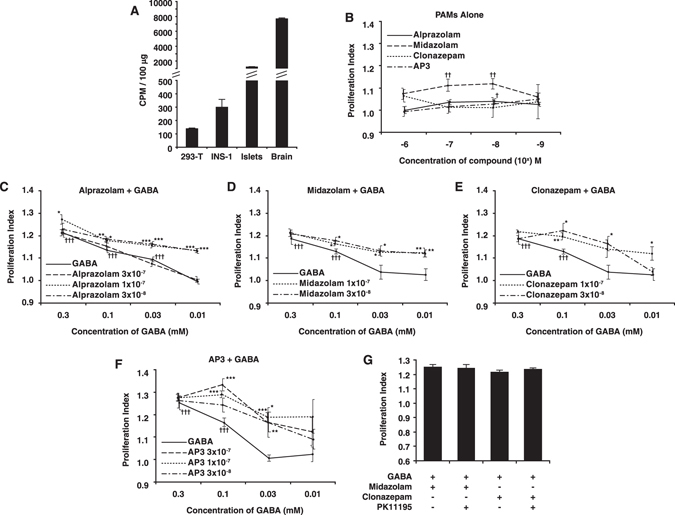
Figure 2.

(A) GAD enzymatic activity in INS-1 cells. The GAD enzymatic activity within homogenates was assessed using a standard CO2 trapping assay as described in Methods. Data shown are mean CPM + /− SEM from a representative assay from three experiments. (B) Effect of PAMs on INS-1 cell proliferation. INS-1 cells were cultured with the indicated PAM at a dose range of 10−9 to 10−6 M and assessed for their proliferation. Data shown are the average rate of proliferation relative to that of cultures with media alone (designated as 1). INS-1 cells were treated with alprazolam (C), midazolam (D), clonazepam (E), or AP-3 (F) at the indicated concentrations along with a dose range of GABA. Control cultures were incubated with GABA alone at the indicated concentration (solid lines). ††††p < 0.001 versus control cultures with medium alone. *p < 0.05, **p < 0.01, ***p < 0.001 versus cultures with the same dose of GABA, determined by Student T test. G) INS-1 cells were cultured with GABA (0.3 mM) and midazolam or clonazepam (100 nM) with, or without, the TSPO inhibitor PK11195 (1 µM) for 48 hrs.
