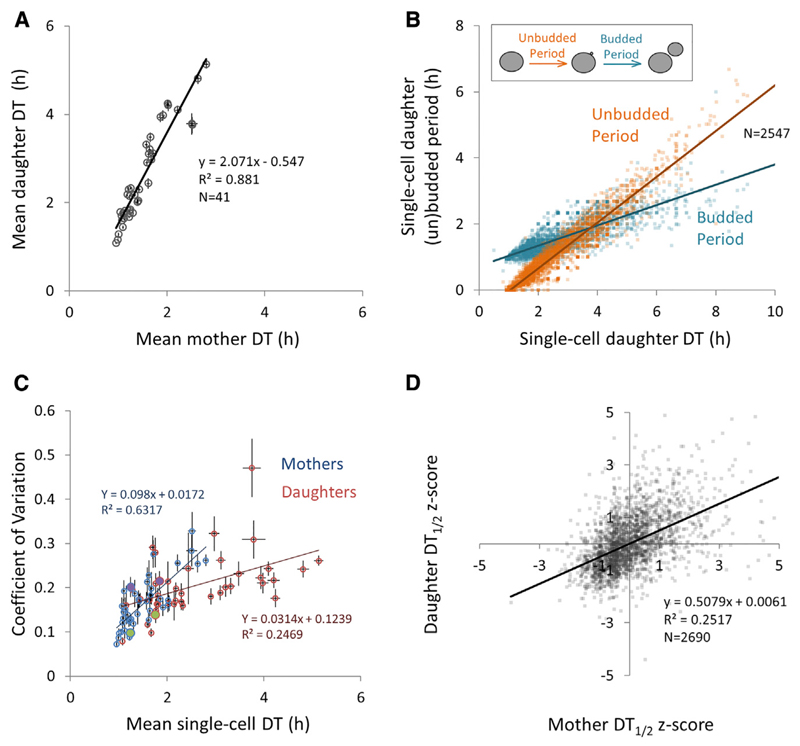
Figure 2. Architecture of Individual Yeast DT Traits.
(A) Mean mother and daughter DTs are linearly correlated across different yeast strains growing exponentially in different carbon sources.
(B) The lengths of the unbudded and budded periods are plotted against the total daughter DT, with each data point representing a single-cell measurement (data comprise all usable daughter DT measurements obtained in this study; n = 2,547 cells).
(C) DT CoV is plotted against mean mother (blue) and daughter (red) DTs. The green and purple fills (respectively, the strains Y55 and BC187, growing in 2.5% galactose) illustrate how some strains can have the same mean DT but different variance.
(D) The DT length is epigenetically inherited across closely related cells within a lineage. This graph shows the correlation between DTs of a mother and her most recently born daughter (Z scores of mother DT1/2 versus Z scores of daughter DT1/2) across the whole dataset.
All error bars represent bootstrapped SDs. Mother DT1/2, the first or second doubling time of the mother cell; daughter DT1/2, the doubling time of the first or second daughter cell. See also Supplemental Experimental Procedures, Figures S1B–S1G, and Dataset S1.

