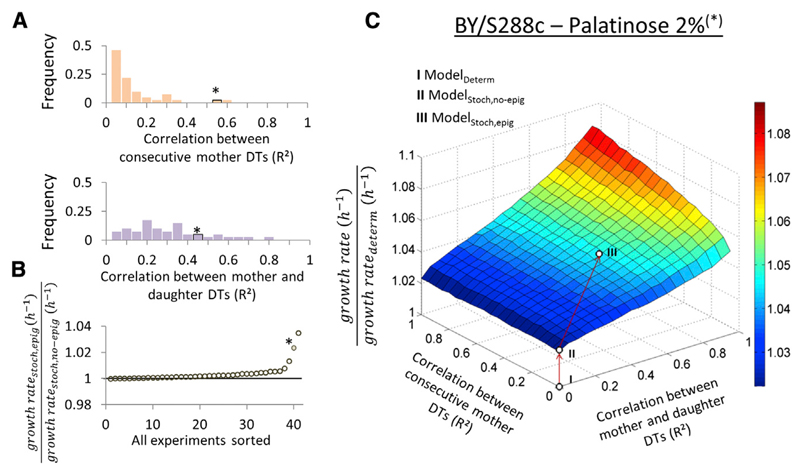
Figure 5. Epigenetic Inheritance of Single-Cell Growth Rates Further Increases Population-Level Growth Rates.
(A) Two experimentally observed DT correlations were considered in the model: (top) mother DT1 versus mother DT2 and (bottom) mother DT1/2 versus daughter DT1/2. Here, histograms of the R2 values of these correlations are shown per experiment. The asterisk marks the bin that includes BY/S288c in 2% palatinose.
(B) The ratio of the growth rates of the model with epigenetics (ModelStoch,epig) and without epigenetics (ModelStoch,no-epig) were calculated for each experiment and sorted from low to high. The asterisk marks the data point corresponding to BY/S288c in 2% palatinose.
(C) The effect of epigenetic single-cell DT correlations on the predicted population-level growth rate is illustrated with a heatmap. Colors indicate fold increase of a given model over the deterministic model. The dots (I–III) are predictions of the deterministic model (I) or the stochastic model without (II) or with (III) epigenetics for BY/S288 growing in 2% palatinose.
See also Figure S5.

