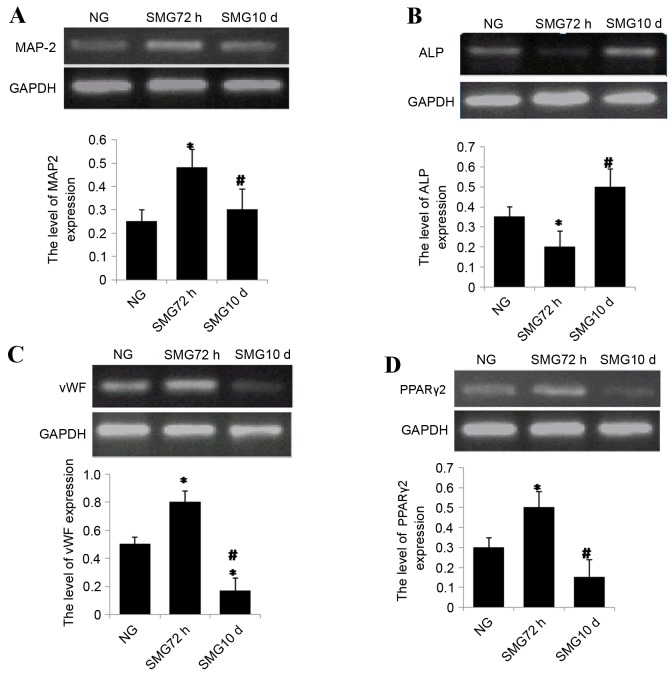
Figure 2.
(A) Semi quantitative reverse transcription polymerase chain reaction analysis of (A) MAP-2 following neuronal differentiation, (B) ALP following osteogenic differentiation, (C) vWF following endothelial differentiation and (D) PPARγ2 expression following adipogenic differentiation. Gene expression was normalized to endogenous GAPDH. The results represent three independent experiments. *P<0.05 vs. NG group, #P<0.05 vs. 72 h. MAP-2, microtubule-associated protein 2; ALP, alkaline phosphatase; vWF, von Willebrand factor; PPARγ2, peroxisome proliferator-activated receptor γ2; GAPDH, glyceraldehyde 3-phosphate dehydrogenase; NG, normal gravity; SMG, simulated microgravity.

