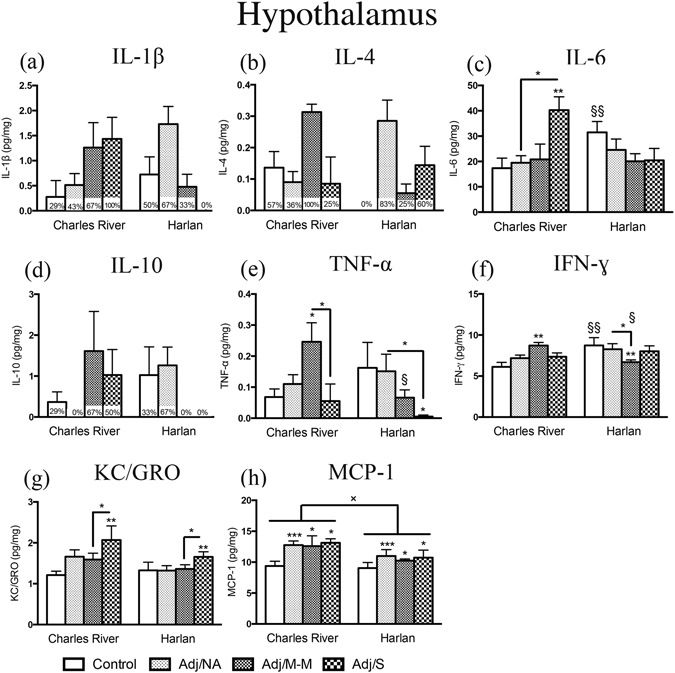
Figure. 3.

Cytokine levels in the hypothalamus. Bars represent mean cytokine level ± SEM. Data are presented as pg cytokine/mg protein with statistical analysis conducted on Blom transformed (normalized) data. The presence of an asterisk (*) indicates a main effect of AA severity, with the comparison to the control group, unless otherwise indicated. The “×” symbol indicates a significant main effect of colony. The “§” symbol indicates a significant colony × AA severity interaction, with the symbol denoting a comparison between colonies, within rats of the same AA severity state. Percentages on bars indicate the percent of rats with detectable cytokine levels, (within each AA severity state) and these data (a, b, d) were not analyzed statically due to non-normal distribution. Post hoc: */§/× p < 0.05; **/§§ p < 0.01; ***p < 0.001. Control: saline-injected; Adj/NA: no clinical signs of AA following CFA injection; Adj/M-M: mild-moderate AA, clinical score ≥1, <8; Adj/S: severe AA, clinical score ≥8.
