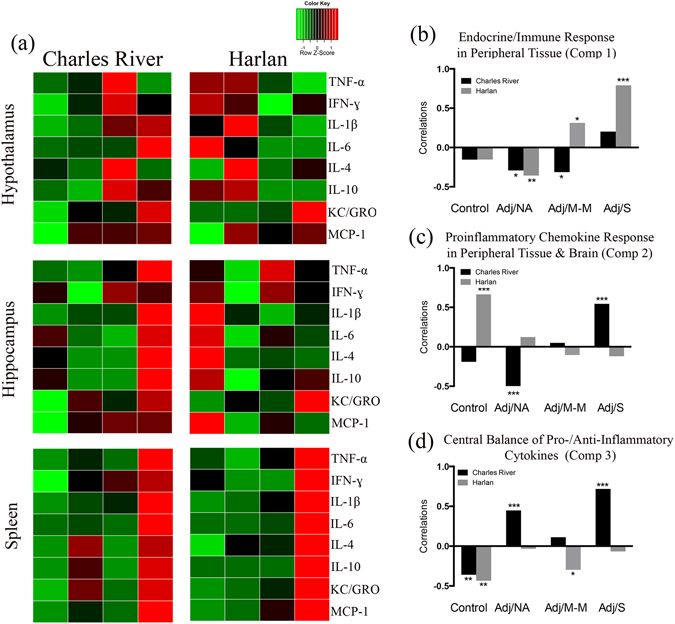
Figure 5.

Endocrine/immune activation in response to complete Freund’s adjuvant (CFA) injection. (a) Heatmaps showing the overall cytokine response to CFA-injection in the hypothalamus, hippocampus, and spleen. Columns represent severity states (control, Adj/NA, Adj/M-M, Adj/S), split by colony, as indicated. Rows represent mean cytokine levels (z-scored data) by severity state, within each tissue. Colors indicate deviations from the mean of zero, as indicated in the colour key. (b–d) Graphical representation of the correlations between the experimental condition (colony, AA severity) and the subjects’ component scores for component 1 (Endocrine/Immune Response in Peripheral Tissue), 2 (Proinflammatory Chemokine Response in Peripheral Tissue & Brain), and 3 (Central Balance of Pro-/Anti-Inflammatory Cytokines) from the CPCA. *p < 0.05; **p < 0.01; ***p < 0.001. Control: saline-injected; Adj/NA: no clinical signs of AA following CFA injection; Adj/M-M: mild-moderate AA, clinical score ≥1, <8; Adj/S: severe AA, clinical score ≥8.
