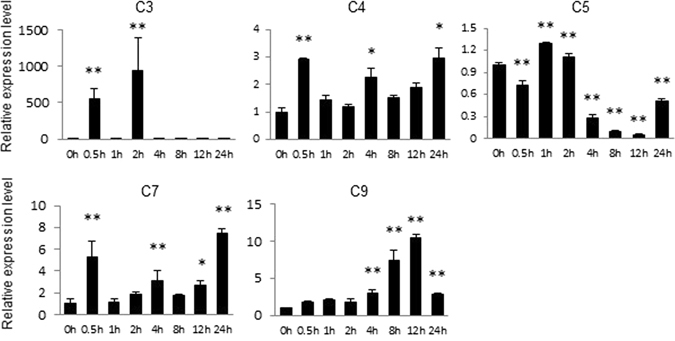
Figure 4.

Expression analysis of five candidate genes induced after salt treatment. The error bars were calculated based on three biological replicates using standard deviation. The cotton histone3 (AF024716) gene was used as the reference gene. “*” at P < 0.05, “**” at P < 0.01.
