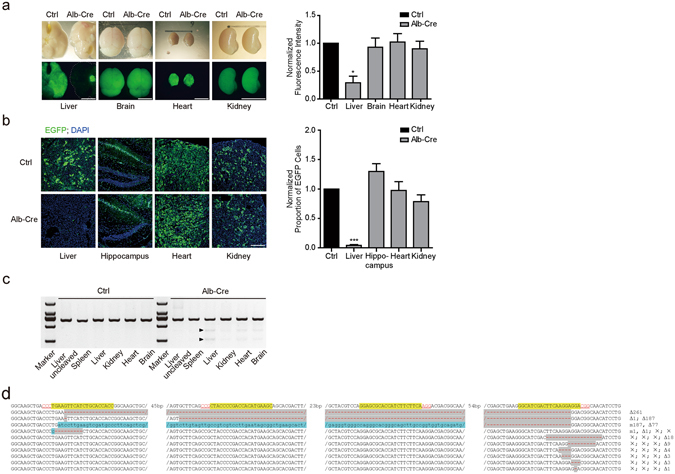
Figure 2.

Tissue-specific mutations of EGFP in sgRNAs EGFP-LSL-Cas9; EGFP; Alb-Cre mice. (a,b) EGFP fluorescence of liver was almost completely eliminated in sgRNAs EGFP-LSL-Cas9; EGFP; Alb-Cre (Alb-Cre) mouse. Control (Ctrl) was sgRNAs EGFP-LSL-Cas9; EGFP mouse. The right panels quantified fluorescence. (a) Paired t-test. liver, *p = 0.0109; brain, p = 0.8084, not significant (ns); heart, p = 0.8893, ns; kidney, p = 0.3101, ns. n = 3. (b) Paired t-test, liver, ***p = 0.0002; brain, p = 0.1486, ns; heart, p = 0.8784, ns; kidney, p = 0.2086, ns. n = 3. Scale bar, 5 mm for (a); 200 μm for (b). (c) T7EN1 assay showed obvious digested bands (arrows) indicating mutations in the lane of Alb-Cre positive mouse, while none in Cre negative mouse (Ctrl). M, maker. (d) Mutated EGFP sequences from sgRNAs EGFP-LSL-Cas9; EGFP; Alb-Cre mouse liver. PAM (Red), sgRNAs targeting sites (yellow grounding), deletion (grey grounding) and base changing (blue grounding) are shown. Δ, deletion; m, mutation; ×, no mutation in the presenting sequence. Numbers following the symbols are base quantity of mutation.
