Figure 2.

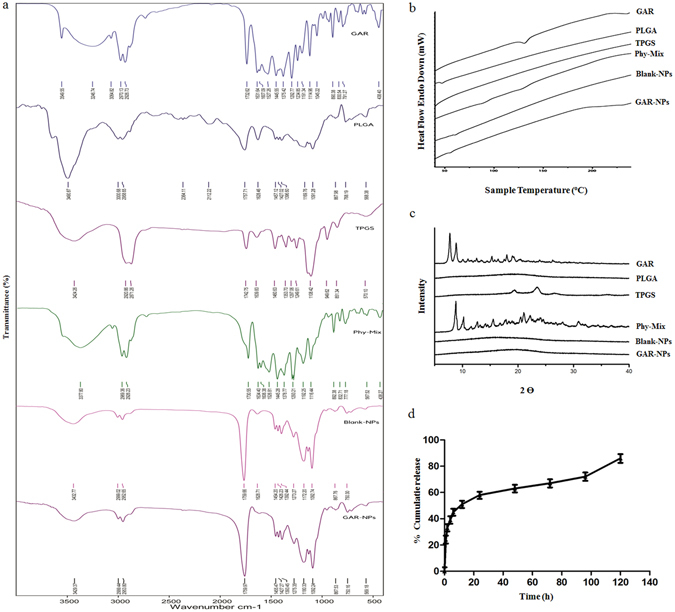
(a) FTIR spectra, (b) DSC thermograms and (c) XRD diffractograms of GAR, PLGA, TPGS, their phy-mix, blank-NPs and GAR-NPs. (d) In vitro drug release profile showing cumulative percent drug release of GAR-NPs vs time.

(a) FTIR spectra, (b) DSC thermograms and (c) XRD diffractograms of GAR, PLGA, TPGS, their phy-mix, blank-NPs and GAR-NPs. (d) In vitro drug release profile showing cumulative percent drug release of GAR-NPs vs time.