
Figure 1.
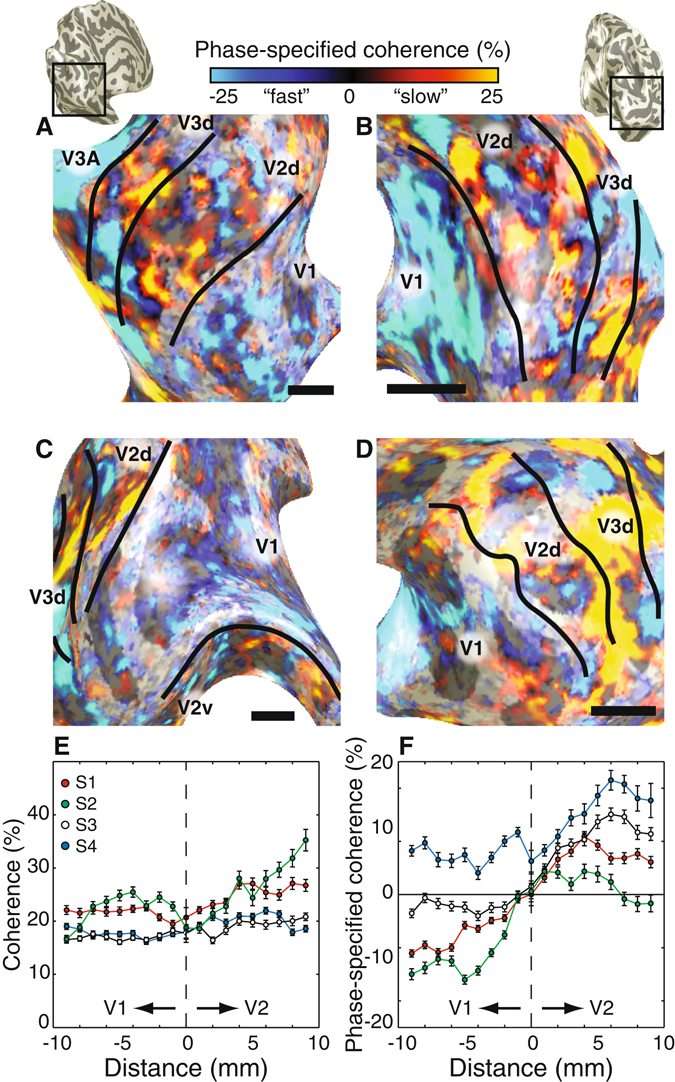
Functional delineation of V2 and V3 stripe-based subdivisions. Phase-specified coherence responses displayed on the left (A,C) and right (B,D) inflated cortical surfaces of three subjects (panels A,B: S3, panel C: S1; panel D: S2). The panels in A–D show the enlarged view of the dorsal occipital lobe with the identified V1/V2d/V3d/V3A borders (top insets). The color bar indicates the phase-specified coherence values, indicating responses dominated by “fast” (7.5 Hz) or “slow” (1.5 Hz) temporal frequencies. Only phase-specified coherence values exceeding an absolute value of 15% are shown. The black horizontal line indicates 1 cm in each panel. The coherence and phase-specified coherence across the V1/V2 border is shown in panels E and F respectively. The coherence is a measure for overall response modulation irrespective of the relative response preference. The coherence values are similar across the border indicating a similar overall response to the stimulus (E). The phase-specified coherence also takes into account which temporal frequency drives the response. The phase-specified coherence changes across the V1/V2 border (F) demonstrating a distinct and systematic change in response properties along the V1/V2 border for all four subjects. The error bars reflect standard error of the mean.