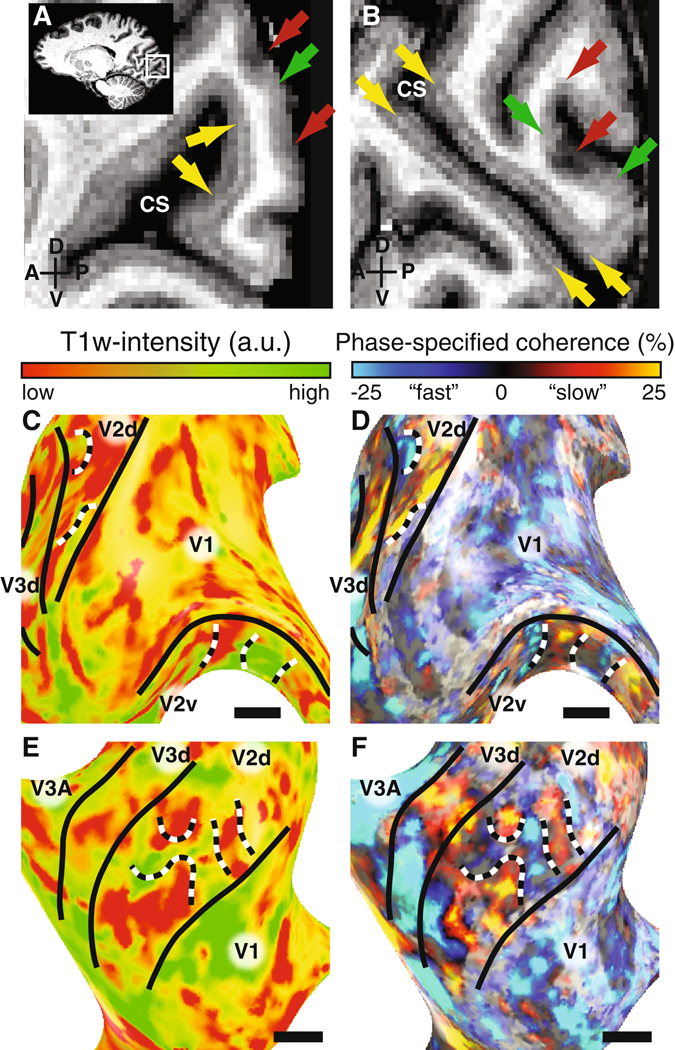
Figure 3.

T1w anatomical delineation of V2 and V3 stripe-based subdivisions. High-resolution T1w data is shown in panels A (S1) and B (S2). The data reveal the stria of Gennari (yellow arrows), and stripes in V2 cortex with low and high T1w intensity, associated with less and more myelinated regions (red and green arrows, respectively). The median T1w intensities across the cortical thickness are shown on the cortical surface in panels C (S1) and E (S3). The corresponding functional responses of these subjects are shown in panels D and F (identical to Fig. 1). The black horizontal line indicates 1 cm in each panel. In line with the functional responses a patchy distribution of T1w intensity is observed along visual cortex. Black and white dashed lines mark borders within V2 that illustrate correspondence between T1w intensity changes and functional responses.
