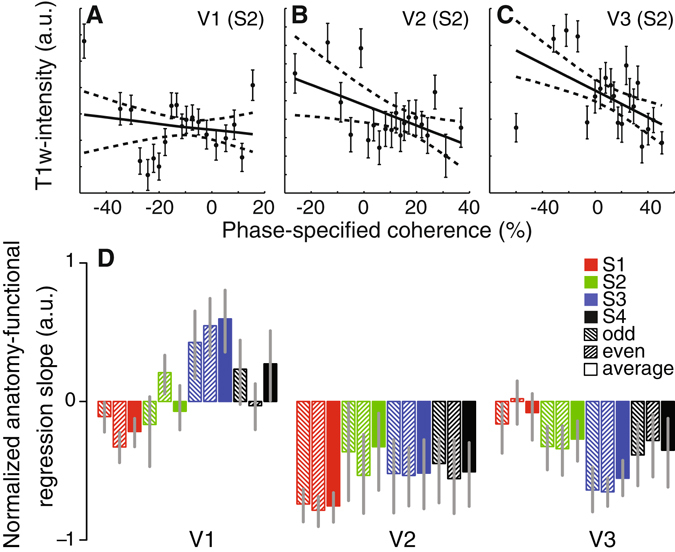
Figure 4.

Relation between anatomical and functional variations of V2 and V3 stripe-based subdivisions. The relationship between functional and anatomical variations for subject S2 in V1, V2 and V3 are shown in panels A–C respectively. The solid and dashed lines indicate the linear relationship and 95% confidence interval obtained by bootstrapping the phase-specified coherence quantiles. The normalized slope between functional and anatomical data for all subjects and independent halves of the data are shown in panel D. All error bars reflect the 95% confidence intervals. We observed a significant relationship between T1w intensity and fMRI response in each subject, except S1 V3, providing converging evidence for the V2 and V3 stripe-based subdivisions. We propose that the V2 and V3 subdivisions that respond more to faster temporal frequencies are more myelinated.
