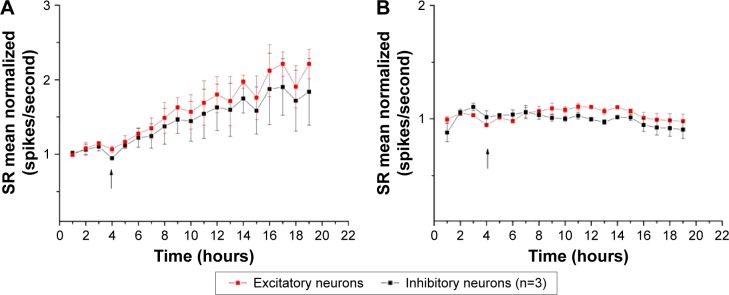
Figure 7.
Normalized averaged SR for experiments with MSNPs of different sizes.
Notes: Each point represents a segment time of 30 minutes, for which averaged data were normalized to mean control value; the arrow indicates MSNP administration. (A) MSNPs of 30 nm increased mean value of SR versus control: in control and at the end of treatment, the averaged data normalized for excitatory (inhibitory) neurons were 1.14±0.03 (1.1±0.06) and 2.21±0.2 (1.8±0.44) Hz, respectively; no significant difference was detected between different time points (P>0.05). (B) MSNPs of 250 nm did not affect the neuronal network. Values presented as mean ± standard error of mean obtained from three replicates (n=3).
Abbreviations: MSNPs, mesoporous silica nanoparticles; SR, spike rate.

