
Figure 3.
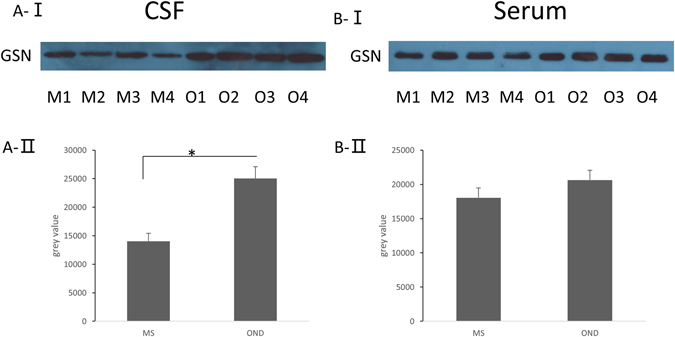
The expression of pGSN is decreased in the CSF, but only changed slightly in the serum of MS patients. A-I, Analysis of pGSN levels in the CSF of MS patients (M1-M4) or OND patients (O1-O4) by Western blot. A-II, We calculated the relative volume percentage of each band using Quantity One software. *p < 0.05 (one-way ANOVA). B-I, Analysis of pGSN levels in the serum of MS patients (M1-M4) or OND patients (O1-O4) by Western blot. B-II, We calculated the relative volume percentage of each band using Quantity One software.