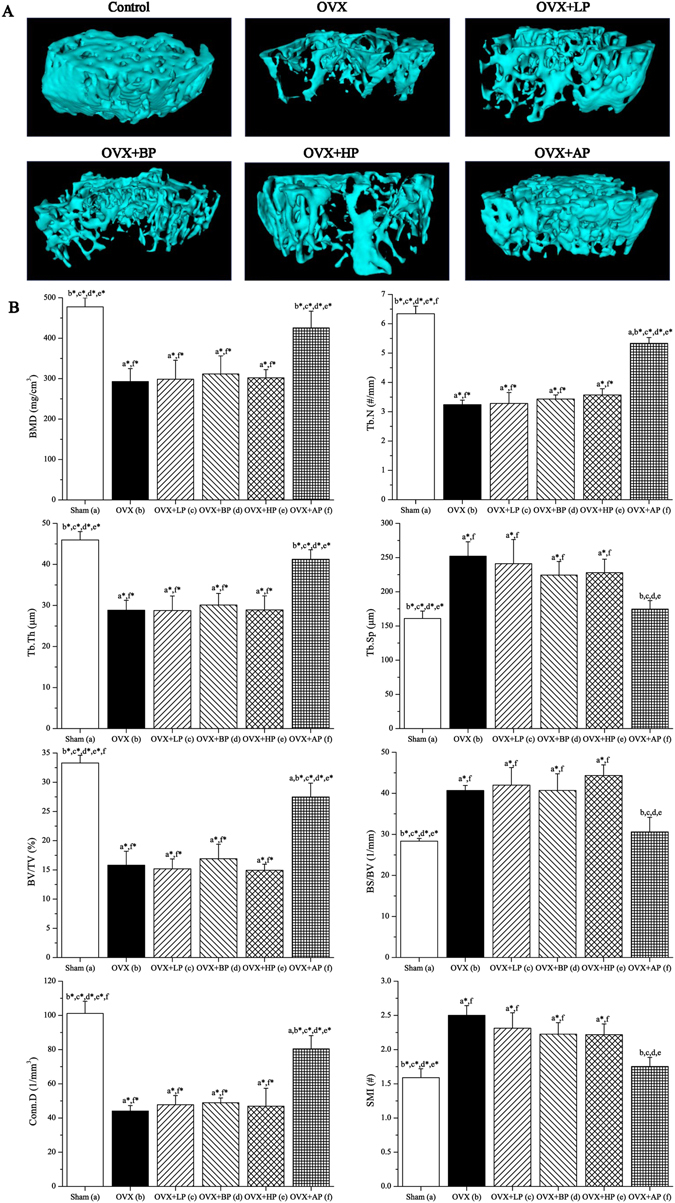
Figure 7.

Effects of 8-week EMF exposure on trabecular bone microarchitecture in the distal femora in OVX mice. (A) Representative 3D µCT images of trabecular bone microarchitecture determined by the a volume of interest (VOI) that was 1 mm long 0.5 mm proximal to the growth plate. (B) Statistical comparisons of indices of trabecular bone microarchitecture. Values represent mean ± SD of 8/group. Letters a-f indicate differences between respective groups at P < 0.05 or *P < 0.01 (a versus Sham; b versus OVX; c versus OVX + LP; d versus OVX + BP; e versus OVX + HP; f versus OVX + AP).
