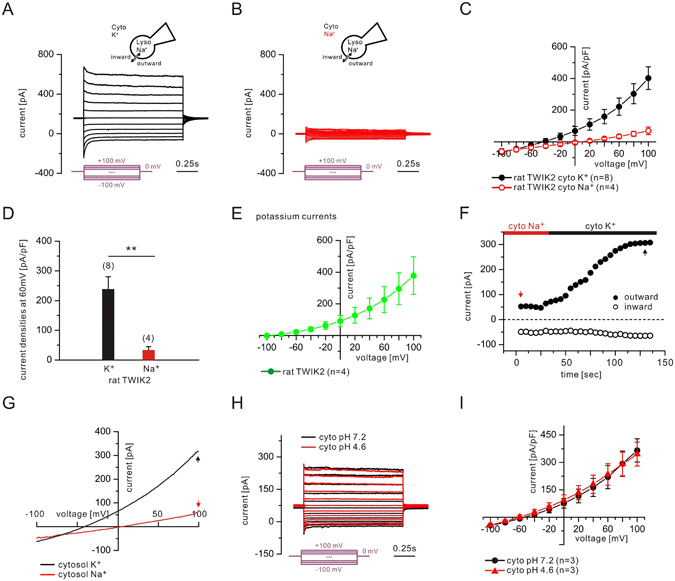
Figure 3.

TWIK2 currents in endolysosomes. Endolysosomal currents were recorded from HEK293T cells expressing rat TWIK2. (A) Currents recorded using a high K+-containing bath solution (145 mM K+, pH 7.2). Step protocols from −100 to +100 mV with a 20 mV step were applied from a holding potential of 0 mV. (B) Currents recorded using a high Na+-containing bath solution (145 mM Na+, pH 7.2). Same step protocol as in (A). (C) I-V relationships constructed from the currents recorded in (A) and (B). (D) Averaged current densities at 60 mV. (E) Potassium I-V curves (defined as ). (F) Representative continuous recordings using ramp protocols (−100 mV to +100 mV in 500 ms, every 5 s, from a holding potential of 0 mV). (G) Recordings at time points (black and red arrows) in (F) were used for the I-V relationships. (H) Current recorded at cytosolic pH 7.4 and pH 4.6. Outward current denotes flow of positive charge into the lumen (pipette) from the cytosol (bath). Numbers of patched endolysosomes are shown in parentheses. Data are represented as mean ± s.e.m. Same step protocol as in (A). (I) I-V relationships constructed from the currents recorded in (H).
