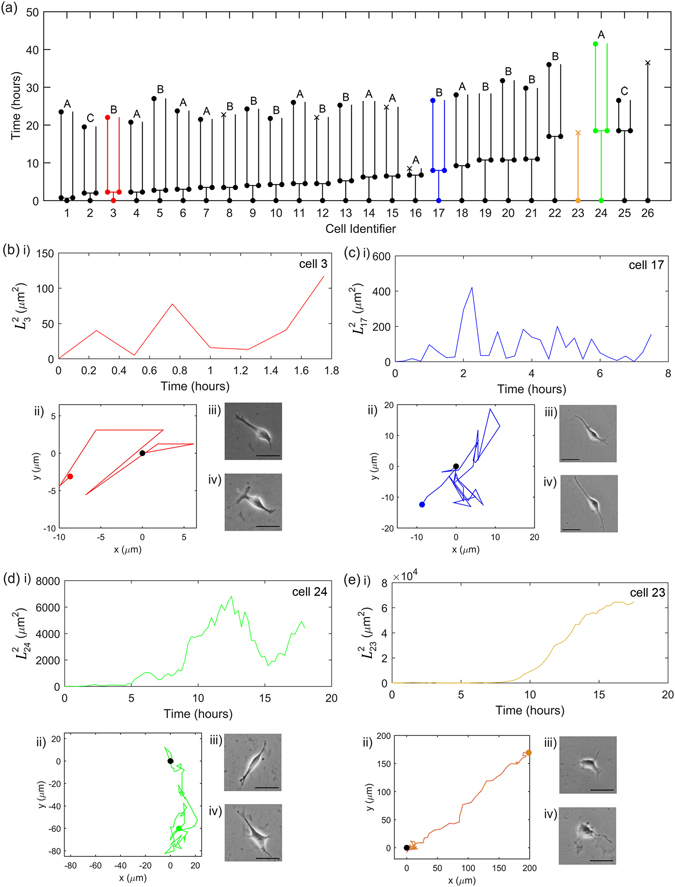
Figure 1.

Single-cell behaviour in the absence of Cell Tracer. (a) The timelines of the 26 single cells. A filled circle indicates that the cell has divided, a cross indicates the cell has died, and no marker indicates that the image was not clear enough to identify the cell confidently; in both cases, we did not track cells beyond this point. The range of behaviours is illustrated with Cell 3 (red), 17 (blue), 23 (orange) and 24 (green), as detailed in Panels (b–e). The predominant behaviour is that similar to Cell 17. In each case, we show (i) as a function of time, (ii) the cell trajectory (with the black and coloured circles indicating the start and end of the trajectory, respectively), and its microscopy images at (iii) the start of the recording and (iv) close to the end of its walk. The length of the scale bar shown within the microscopic images is 50 μm. The sampling interval is 15 minutes and the microscope resolution is 0.62 μm/pixel.
