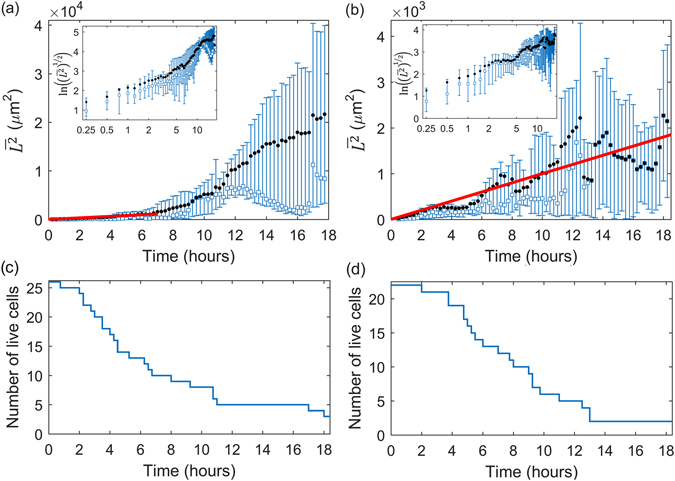
Figure 3.

The evolution of the mean (black circles) and median (blue squares) displacements of single unstained cells (a) and stained cells (b) with red lines showing straight-line least-squares fits (constrained to pass through the origin) of with D = 79.8 ± 5.2 μm2/hr for unstained cells and D = 49.1 ± 3.5 μm2/hr for stained cells. Error bars show the upper and lower quartiles. Insets show the root-mean-square displacement vs time on natural logarithmic axes. The number of live cells over time for unstained cells (c) and stained cells (d) indicate the changing sample size. The sampling interval is 15 minutes.
