
Figure 1.
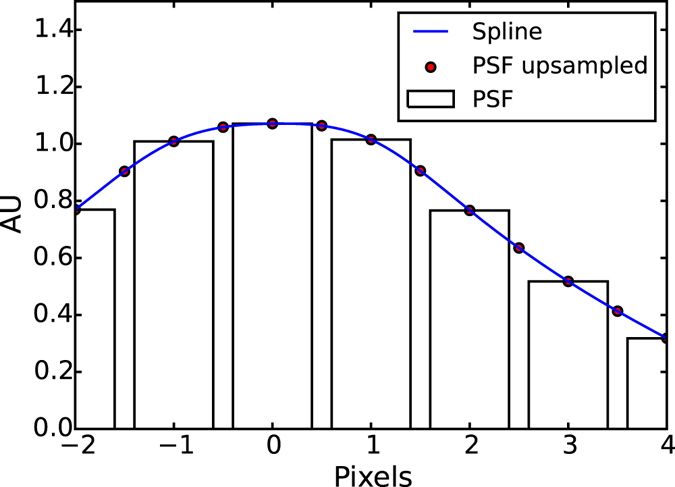
1D Spline example. Each cubic spline interval (the blue line) is determined such that itself and its first derivative are continuous across the red points which are the interval boundaries. The red points are calculated by up-sampling the measured PSF (grey bars) by a factor of two using 3rd order spline interpolation.