
Figure 3.
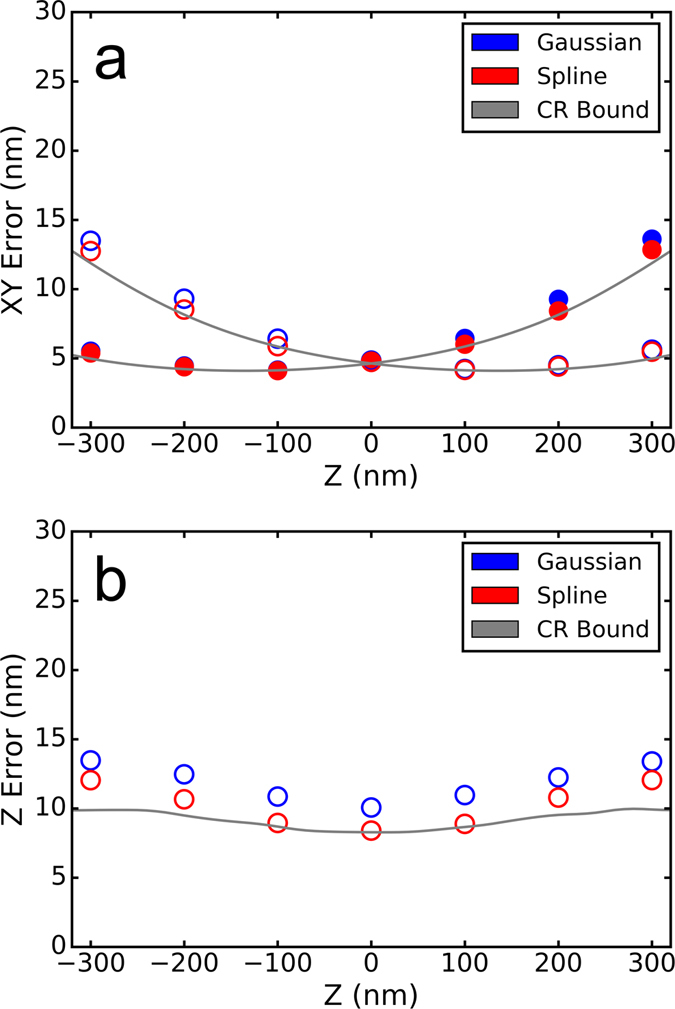
Astigmatic PSF fitting accuracy. (a) Average xy fitting error as a function of z for cubic spline versus elliptical Gaussian fitting. Ellipitical Gaussian fitting was performed with the 3D DAOSTORM algorithm that we reported previously18. The filled points are the error in x and the hollow points are the error in y. Each data point is the average of multiple independent z positions in the 100 nm range centered on the data point. The solid gray lines are the Cramer-Rao theoretical bounds calculated following ref. 8. (b) Average z fitting error as a function of z and the Cramer-Rao theoretical bound. The z fitting error and the Cramer-Rao bounds are determined as described in (a).