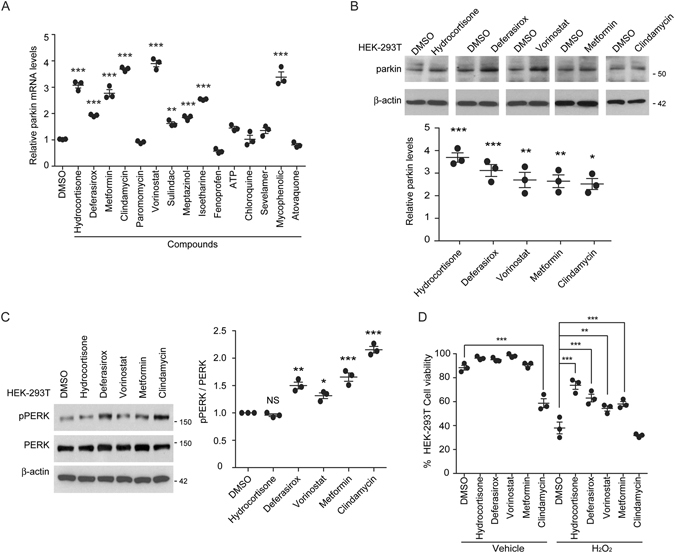
Figure 2.

Parkin inducers prevent HEK-293T cell death induced by oxidative stress. (A) Real time quantitative PCR quantification of relative parkin mRNA levels in HEK-293T cells treated by the top 15 compounds selected from luciferase assay (Fig. 1D). Their levels were normalized to that of GAPDH as an internal loading control (n = 3). (B) Western blot analysis of parkin expression in HEK-293T cells treated with 10 µM of indicated compounds. DMSO was used as vehicle control (upper panel). Relative parkin protein levels in each compound-treated group were normalized to the level of β-actin. DMSO was used as a negative control for compound treatment (n = 3 independent experiments per group). (C) Representative western blot images of PERK and phosphorylated PERK (pPERK) in HEK-293T cells treated with the indicated parkin inducing compounds (left panel). Relative pPERK levels were normalized to total PERK levels (right panel) as an indicator of ER stress (n = 3 per group). (D) Viability of HEK-293T cells treated with indicated parkin inducing compounds and challenged with hydrogen peroxide (500 µM, 90 min) determined by trypan blue exclusion assay (n = 3 per group). Quantified data are expressed as mean ± s.e.m. *P < 0.05, **P < 0.01 and ***P < 0.001, unpaired two-tailed Student’s t test (B) or ANOVA test followed by Tukey post hoc analysis (A,C,D). Full blots (for cropped images in B,C) are presented in Figure S6.
