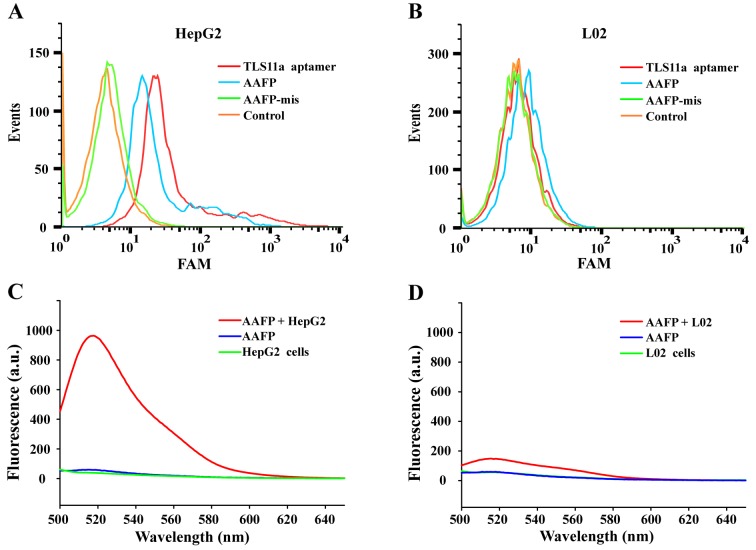
Figure 2.
Analysis of target binding by AAFP using flow cytometry and fluorescence spectroscopy. (A and B) TLS11a aptamer, AAFP or AAFP-mis were incubated with (A) HepG2 or (B) L02 cells, which were then analyzed by flow cytometry. (C and D) Fluorescence spectra were recorded for AAFP (250 nM) on its own in PBS, cells on their own (~5×10⁵ cells/ml) or mixtures of AAFP and cells incubated. Experiments with (C) HepG2 and (D) L02 cells.

