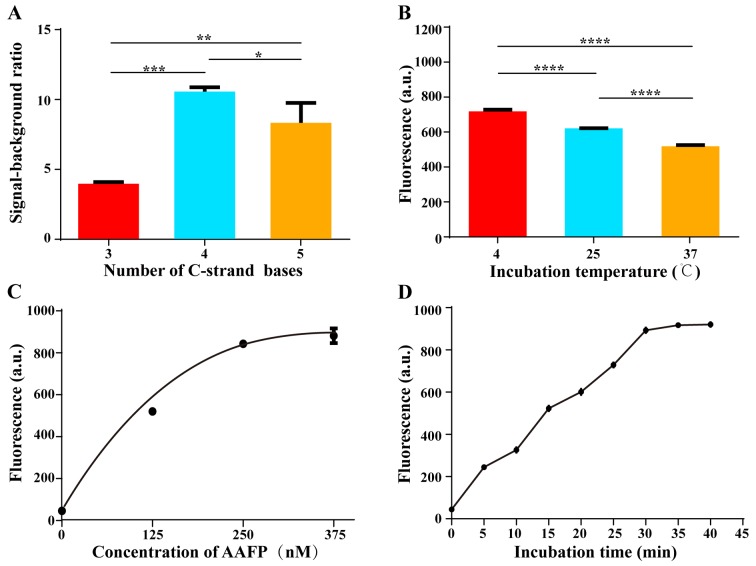
Figure 3.
Optimization of C-strand length and detection conditions. (A) Dependence of signal-to-background ratio on the number of bases on the C-strands. (B) Fluorescence intensity of AAFP at 250 nM after 30 min of incubation with HepG2 cells at 4, 25 and 37̊C. (C) Fluorescence intensity of AAFP at different concentrations after 30 min of incubation with HepG2 cells at 4̊C. (D) Fluorescence intensity of AAFP at 250 nM after incubation with HepG2 cells at 4̊C for different lengths of time. Data are expressed as the mean ± SD of 3 independent experiments; *P<0.05, **P<0.01, ***P<0.001, ****P<0.0001.

