
Figure 7. HSD consumption induces inflammation in the nodose ganglia and withdrawal of sensory fibers within the hindbrain.
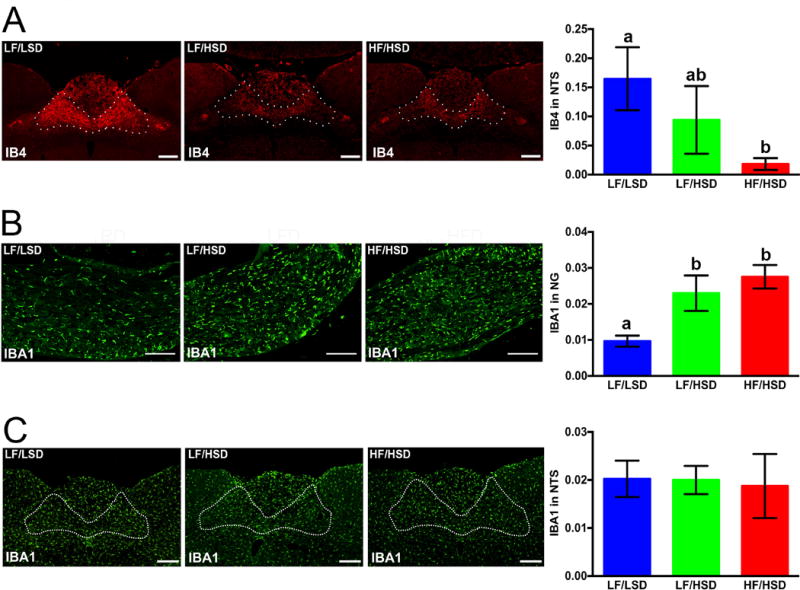
A. Representative coronal sections of the intermediate NTS (outlined) revealing more IB4-immunoreactive fibers in rats fed with LF/LSD compared to LF/HSD or HF/HSD for four weeks. Quantification on the left shows binary analysis of the area of IB4-labeled vagal afferents in the NTS by using Nikon Element’s binary imaging analysis software; n=4 per group. The one-way ANOVA with a Tukey-Kramer post-hoc correction shows a significant decrease in IB4-labeled vagal afferents in HF/HSD compared to that of LF/LSD (P≤0.05). All data are expressed as average ± SEM; a,b,cMean values at week 4 with unlike letters were significantly different. Scale bar = 250μm.
B. Representative sections of the nodose ganglion revealing Iba1-immunoreactive microglia. Quantification on the left shows binary analysis of the area of Iba1-labeled microglia in the nodose ganglion by using Nikon Elements binary imaging analysis software. n=4 per group. The one-way ANOVA with a Tukey-Kramer post-hoc correction shows significant increase Iba1 labeling in both HF/HSD (P≤0.001) and LF/HSD (P≤0.05) compared to that of LF/LSD. Scale bar = 250μm. All data are expressed as average ± SEM; a,b,cMean values at week 4 with unlike letters were significantly different.
C. Representative sections of the NTS revealing Iba1-immunoreactive microglia. Quantification on the left shows binary analysis of the area of Iba1-labeled microglia in the NTS by using Nikon Elements binary imaging analysis software. n=4 per group. Statistical significance was measured by one-way ANOVA with a Tukey-Kramer post-hoc correction. No significant increase Iba1 labeling was found between the groups. All data are expressed as average ± SEM; Scale bar = 250μm.