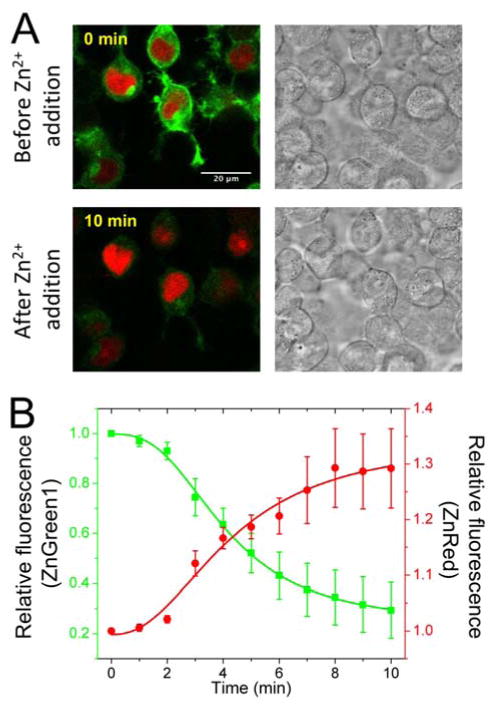
Figure 4. Fluorescence monitoring of Zn2+ diffusion in HEK 293T cells.
(A) Fluorescence and brightfield images of cells expressing ZnGreen1 at cell surface and ZnRed in the nucleus before and after addition of Zn2+/pyrithione (scale bar: 20 μm). (B) Represented traces (n = 6 cells) for intensity changes, showing Zn2+-induced decrease of ZnGreen1 fluorescence (extracellular) and increase of ZnRed fluorescence (nuclear).

