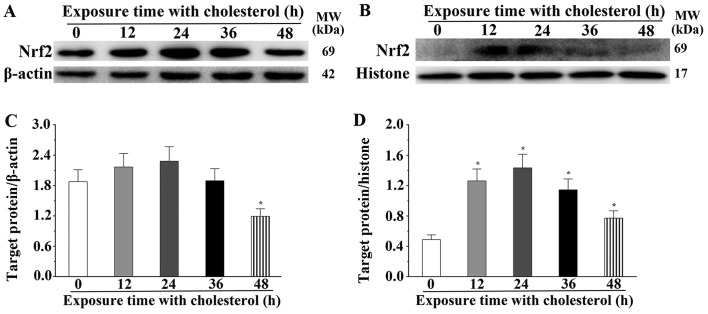
Figure 5.
Effects of cholesterol on the expression of nuclear factor erythroid 2-like 2 (Nrf2). (A) Western blot analysis was used to evaluate the expression levels of Nrf2 in the cytoplasm. (B) Western blot analysis was used to evaluate the expression levels of Nrf2 in the nucleus. (C and D) The expression levels of Nrf2 in the cytoplasm and nucleus as quantified by densitometry. β-actin was used as an internal control. Data are presented as means ± SEM of three individual experiments. P values were calculated using one-way ANOVA. *P<0.05 vs. the control group.

