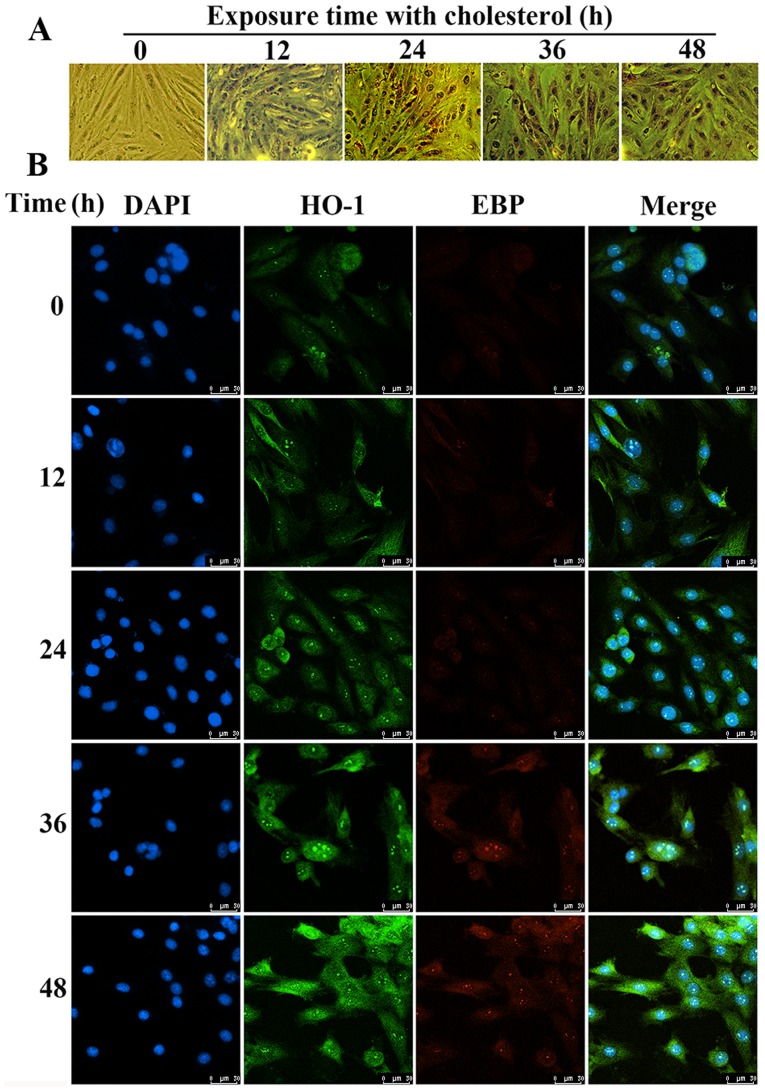
Figure 6.
Measurements of lipid accumulation and location of heme oxygenase-1 (HO-1) and emopamil-binding protein (EBP) in H9c2 cells following cholesterol stimulation. (A) Oil Red O staining indicated that the concentration of cholesterol was increased in the cholesterol groups. (B) The interaction between HO-1 and EBP was noted in the cell membrane, cytoplasm and nucleus, and both showed the same upregulated expression trend using confocal microscopy (magnification, ×200).

