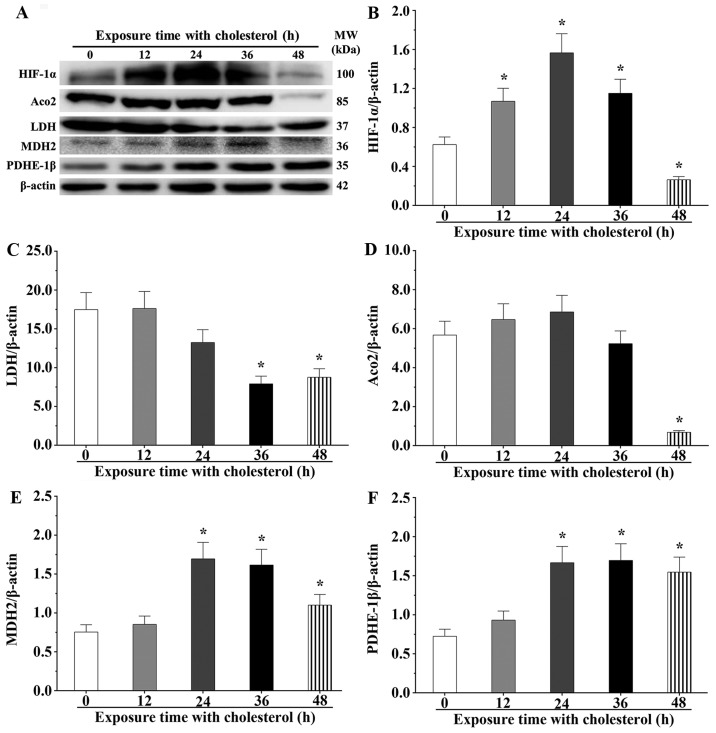
Figure 7.
Cholesterol inhibits the expression of LDH and activates the expression of hypoxia inducible factor-1α (HIF-1α) and mitochondrial enzymes. (A) Western blot analysis was used to evaluate the expression levels of each protein. β-actin was used as an internal control. (B–F) The expression level of each protein was quantified by densitometry. Data are presented as means ± SEM of three individual experiments. P-values were calculated using one-way ANOVA. *P<0.05 vs. the control group.

