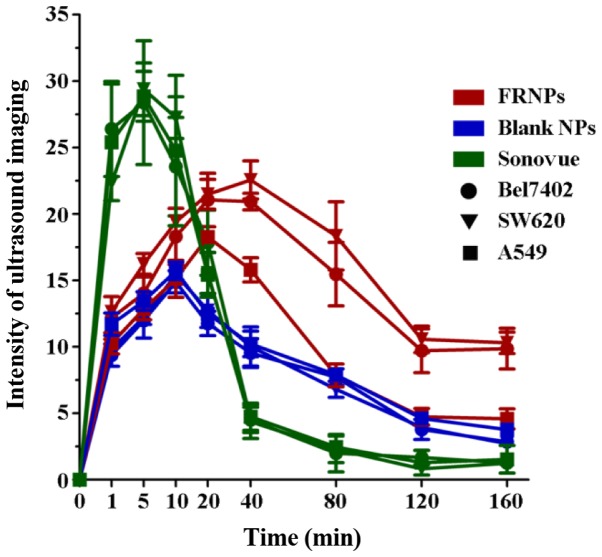
Figure 6.
The time-intensity curve of folate-receptor targeted nanoparticles (FRNPs), blank NPs and Sonovue in the 3 types of xenografts. Red curves show the changes of enhancement after injection of FRNPs in xenografts, blue curves show the changes of enhancement after injection of NPs and green curves show the changes of enhancement after injection of Sonovue, whereas the circles represent the imaging data collect from Bel7402 xenografts, the triangles represent the imaging data collect from SW620 xenografts and the squares represent the imaging data collect from A549 xenografts.

