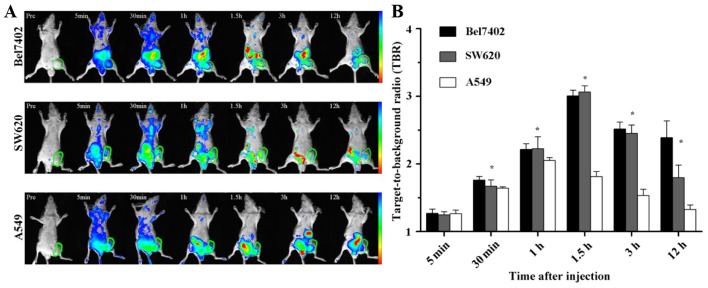
Figure 7.
In vivo NIR imaging of xenografts at different time intervals after administration of Cy7-labeled FRNP and the green circles indicate the tumor regions (A). (B) Target-to-background ratio (TBR) of the xenografts after injection is shown as the mean ± SD (n=3), *P<0.05. The range from blue to red in (A) represents the changes in fluorescence intensity from weak to strong.

