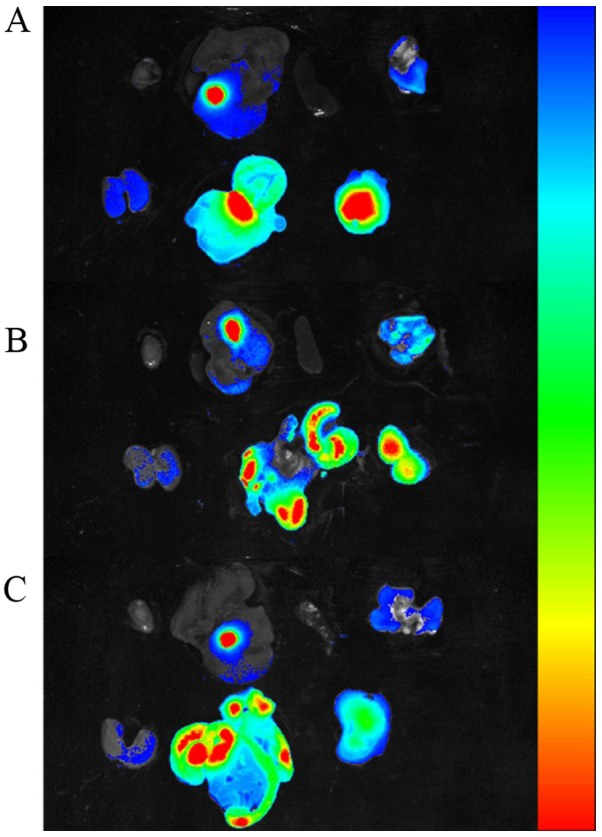
Figure 8.
Ex vivo NIR imaging of other organs and tumor tissues at 12 h post-injection, collected from 3 types of xenografts, (A) Bel7402, (B) SW620, (C) A549 tumor xenografts. (A, B and C) Organs and tumor tissue are included in proper sequence in the top row and bottom row. Top row, heart, liver, spleen, lung were arranged from left to right; bottom row, kidneys, intestines, tumor tissue were arranged from left to right. The range from blue to red represents the changes in fluorescence intensity from weak to strong.

