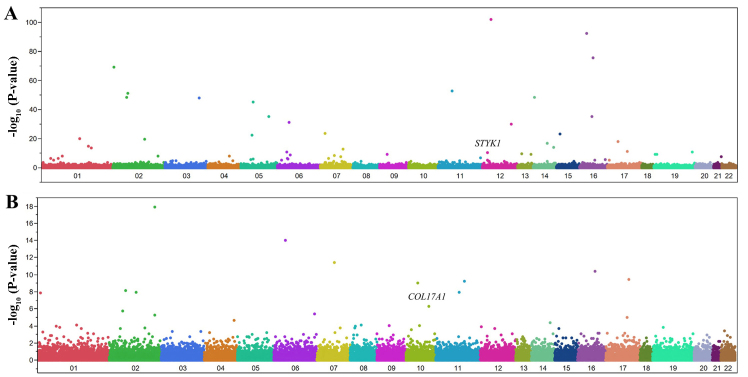
Figure 3.
Manhattan plots for P-values of allele frequencies in the EWASs of (A) ICH or (B) SAH. The P-values (y-axis) are plotted as −log10(P) with respect to the physical chromosomal positions of the corresponding SNPs (x-axis). The two SNPs ultimately found to be significantly associated with ICH (STYK1) or SAH (COL17A1) are indicated.

