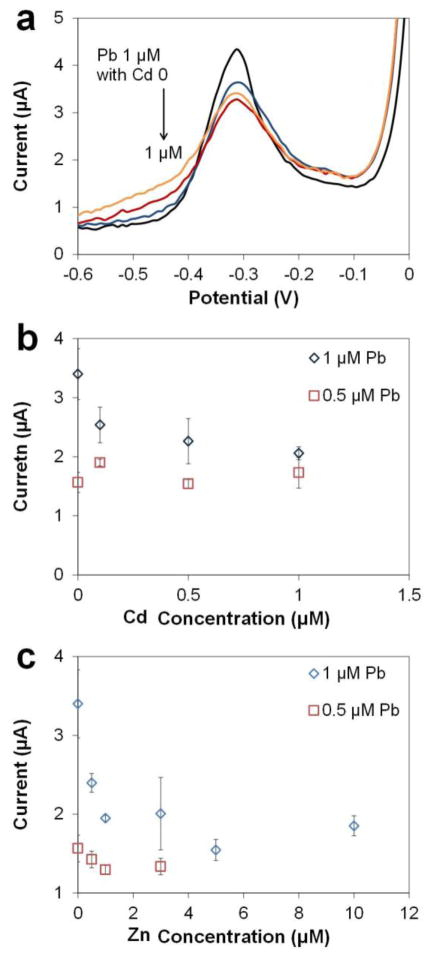
Fig. 6.
ASV of fixed concentrations of Pb (0.5 μM and 1 μM) with increasing concentrations of Cd and Zn in acetate buffer (0.1 M, pH 5.5), 100 μL sample. (a) Voltammograms of 1 μM Pb with increasing Cd. (b) Pb peak currents of 0.5 μM and 1 μM Pb in the presence of different concentrations of Cd. (c) Pb peak currents of 0.5 μM and 1 μM Pb in the presence of different concentrations of Zn. (Preconcentration potential −0.8 V and time 300 s, amplitude 50 mV, period 50 ms, increment 8 mV.)

