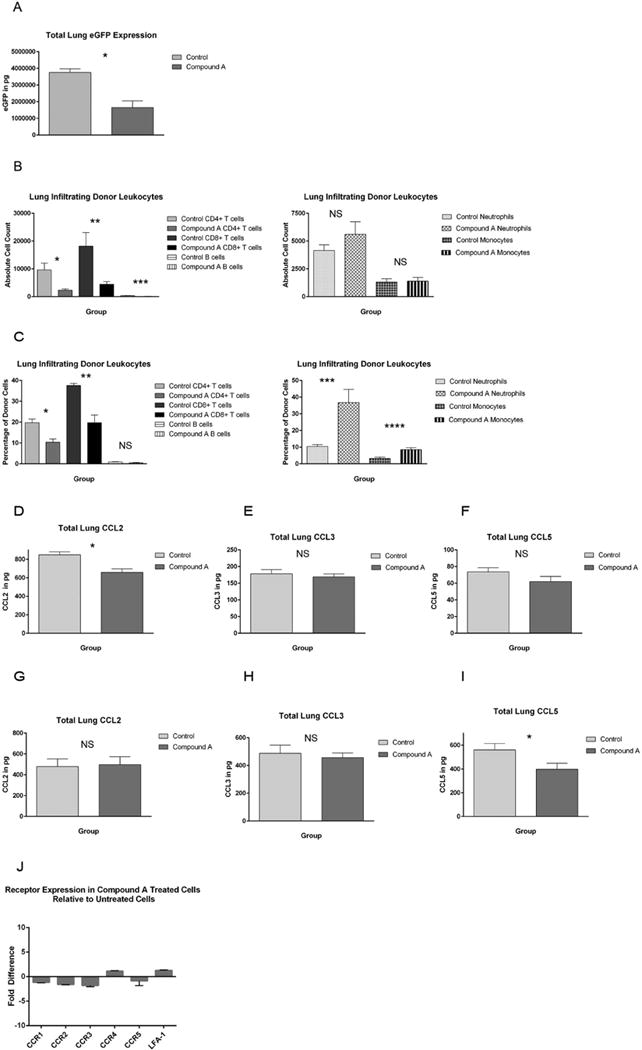
Figure 5. Compound A reduces pulmonary chemokine levels and donor T cell accumulation within the host lung in a mouse IPS model.

(A) B10.BR mice were administered cyclophosphamide at 120mg/kg by IP injection on transplant days −3 and −2. They were then irradiated to 700 rads on day −1. On day 0, recipient mice were administered 1×10⁷ TCD BM cells from eGFP+ B6 mice + 7×10⁶ NK1.1-depleted eGFP+ B6 splenocytes +/− Compound A dosed at 175mcg once daily by IP injection on days 0–13. The mice were killed on transplant day +14 and their left lung removed and homogenized. Total eGFP levels were then determined by ELISA. n=5 mice per group *P=0.0016 by Student’s t test. (B, C) B10.BR mice were transplanted as before and then killed on transplant day +14. Their right lung was then removed and digested using a collagenase/DNA-ase solution. Leukocytes were purified using a percoll gradient and infiltrating donor cell numbers then determined by flow cytometry. Donor cells were distinguished from residual host cells by virtue of their eGFP positivity. (B) Absolute numbers of donor CD4+ T cells, CD8+ T cells, CD19+ B cells, CD11b+Ly6cint neutrophils, and CD11b+Ly6chi inflammatory monocytes are depicted. *P=.0062 by Student’s t test. **P=0.0107. ***P=0.0012. n=8 mice per group. (C) The percentages of each cell type as a fraction of the total number of pulmonary infiltrating donor cells are also shown. *P=0.0015. **P=0.0007. ***P=0.0067. ****P=0.0033. (D–I) B10.BR mice were transplant as before and then killed on either day +7 (D–F) or day +14 (G–I). Their left lung was then homogenized and total chemokine levels determined by ELISA. n=9 control and 8 Compound A mice per group on day +7, and n=12 control and 11 Compound A mice per group on day +14. (D) *P=0.0014. (I) *P=0.0381. (J) Purified B6 CD4+CD25− Tcons were activated in vitro with plate-bound anti-CD3 and anti-CD28 antibody and murine IL-2 at 100 IUs/ml in the presence or absence of 100nM Compound A. The cells were expanded for 48 hours, and total RNA was then isolated. CCR1, CCR2, CCR3, CCR4, CCR5, and LFA-1 expression were then compared between Compound A treated and untreated cells using qRT-PCR. Fold changes for each receptor in treated cells relative to untreated cells are depicted. n=6 replicates per receptor.
