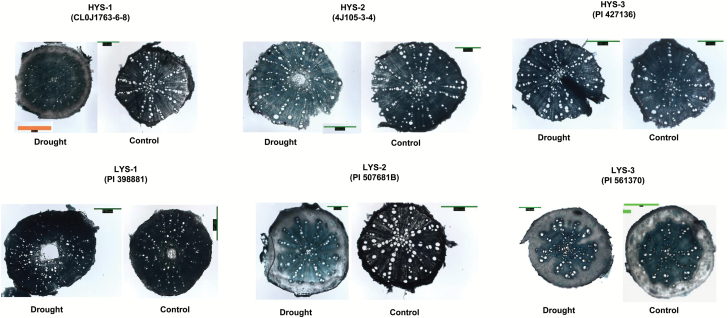
Fig. 5.
Variation in root anatomical response observed in metaxylem and cortex cell area among HYS and LYS lines under irrigated and drought conditions. Scale barS: HYS-1 Drought (1564 μm) and Control (715 μm); HYS-2 Drought (1001 μm) and Control (715 μm); HYS-3 Drought (1001 μm) and Control (715 μm); LYS-1 to 3 Drought (715 μm) and Control (1001 μm).

