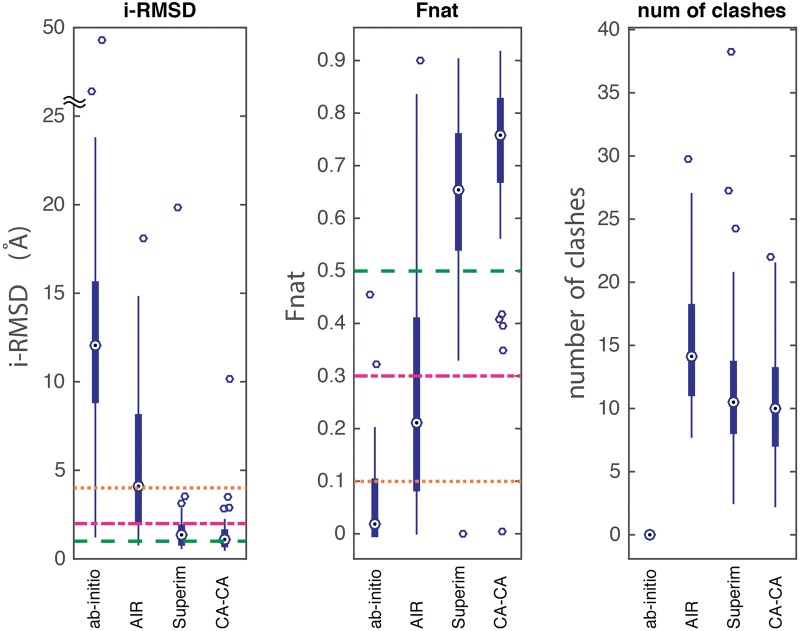
Figure 1.
Average i-RMSD, Fnat and number of atomic clashes of the top four models of the top-ranking cluster generated by four different modeling approaches: ab initio docking, AIR-guided docking, superimposition and CA-CA-guided docking. The lower (Q1), middle (Q2) and upper (Q3) quartiles of each thick bar are 25th, 50th and 75th percentile. IQR is Q3–Q1. Any data value that lies more than 1.5 × IQR lower than the first quartile or 1.5 × IQR higher than the third quartile is considered an outlier (empty circle). The whiskers extend to the largest and smallest values excluding outliers. The median is shown as a circle with a dot. Reference lines of i-RMSD at 1, 2 and 4 Å are drawn (green, purple and red), which correspond to the CAPRI’s standard criteria on excellent, good and acceptable models. Similarly, CAPRI reference lines for Fnat at 0.5, 0.3 and 0.1 are also drawn (green, purple and red). The lower i-RMSD, the higher Fnat and the lower number of clashes, the better a method. A colour version of this figure is available at BIB online: http://bib.oxfordjournals.org.

