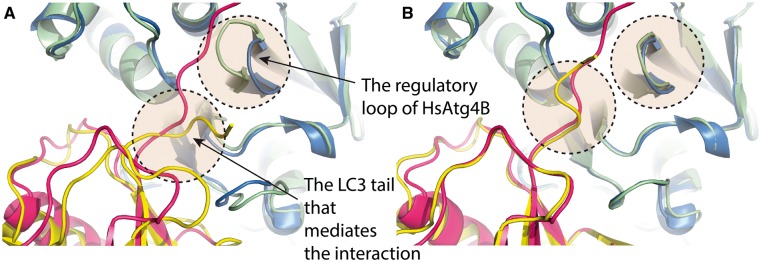
Figure 4.
Comparison of the best models generated by superimposition (A) and CA-CA-guided docking (B) on case HsAtg4B-LC3 (PDB ID: 2Z0E). The models are shown in green and yellow, and the experimentally determined structure in blue and pink. The CA-CA model successfully models the conformational changes of the regulatory loop of HsAtg4B and the LC3 tail on binding. Figures were generated using PYMOL [32].

