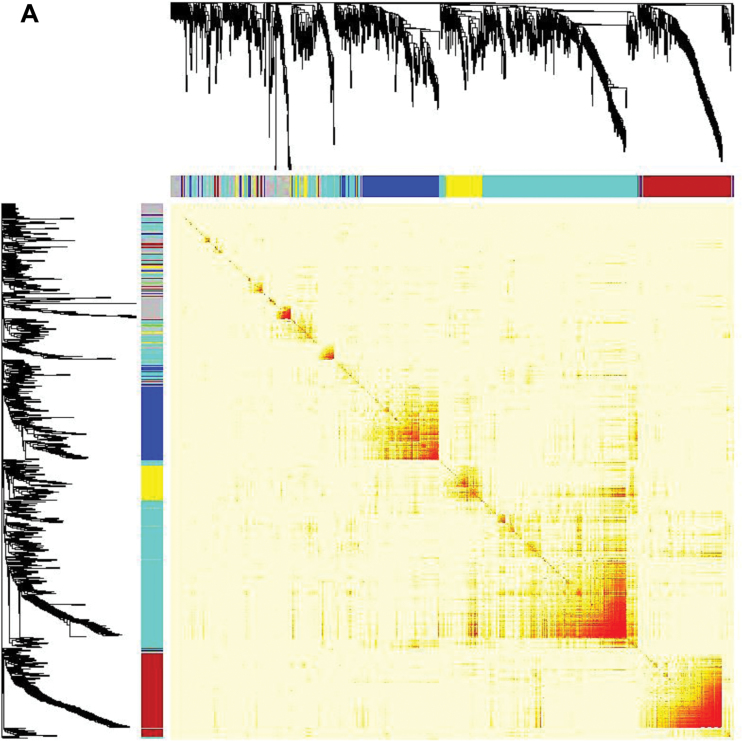
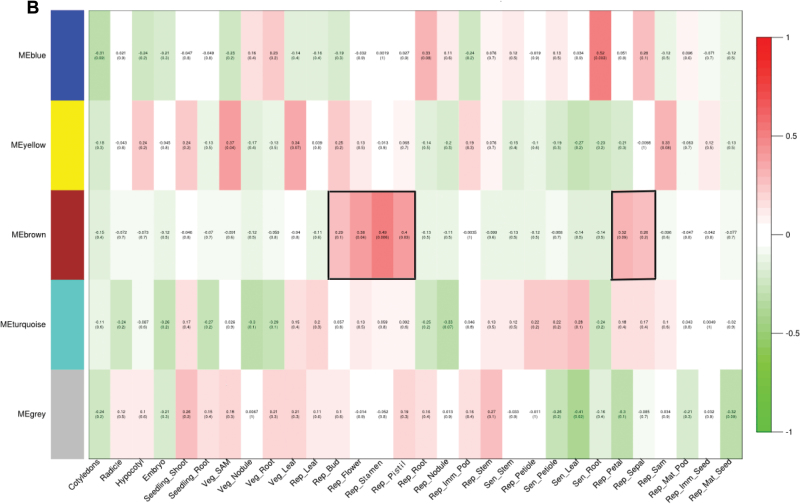
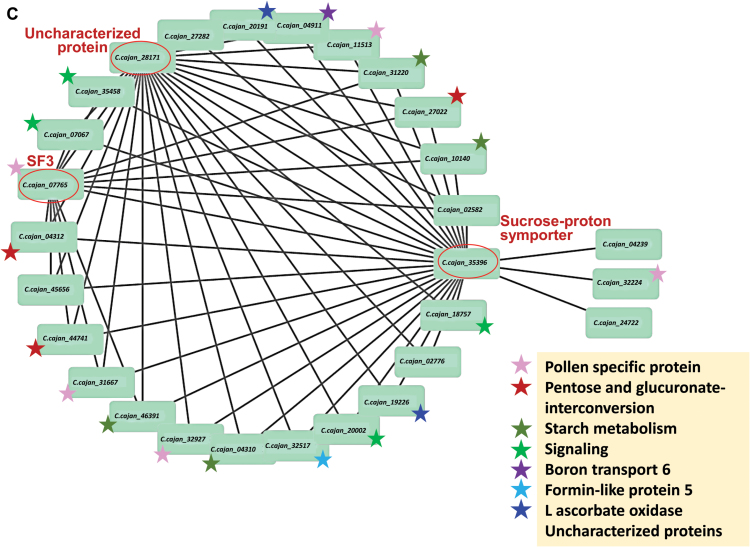
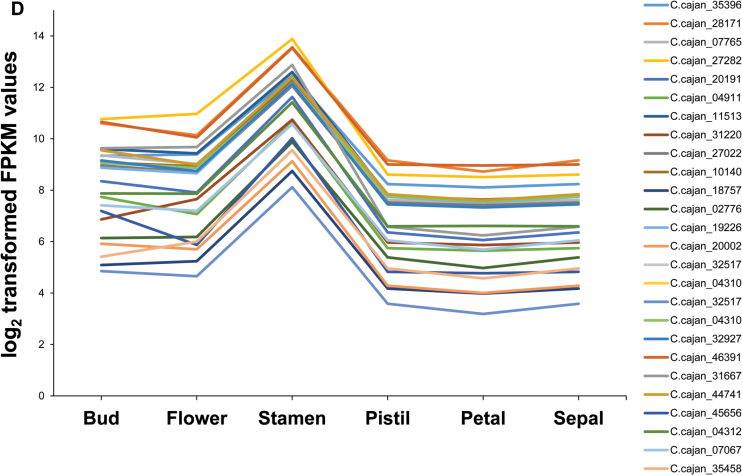
Fig. 7.
Correlation matrix of the differentially expressed genes. (A) Hierarchical clustering of the topological overlap matrix (TOM) of the differentially expressed genes. The color bar at the top and the left of the heatmap shows the module assignment obtained from WGCNA. The intensity of red denotes the absolute value of Pearson’s correlation coefficients between the expression profiles of all pairs of differentially expressed genes, which were transformed into network connection strengths. Rows and columns represent genes and are symmetrical. (B) Module to tissue association. Each row represents a module and each column represents a sample. Red represents a positive correlation, whereas green represents a negative correlation between the module and the sample. (C) Correlation network of the floral transcriptome. (D) Graph depicting co-expressed genes in all the six floral tissues (bud, flower, stamen, pistil, petal, and sepal).


