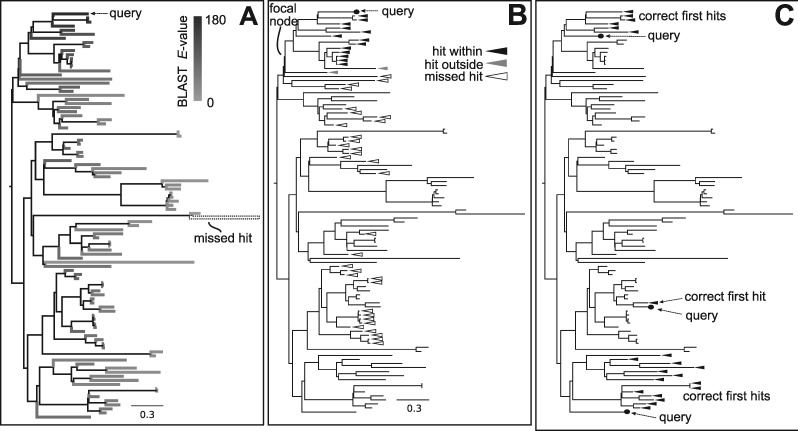
Figure 2.
Analyses of BLAST results examined here. (A) Shows a query taxon and the BLAST –(E)-values as distributed on the phylogeny. (B) Shows a query taxon and a focal node identifying a clade and the missed hits within the clade, hits outside the focal clade and hits within the clade. (C) Three sets of query taxa and the identification of the set of hits that would be correct phylogenetically.

