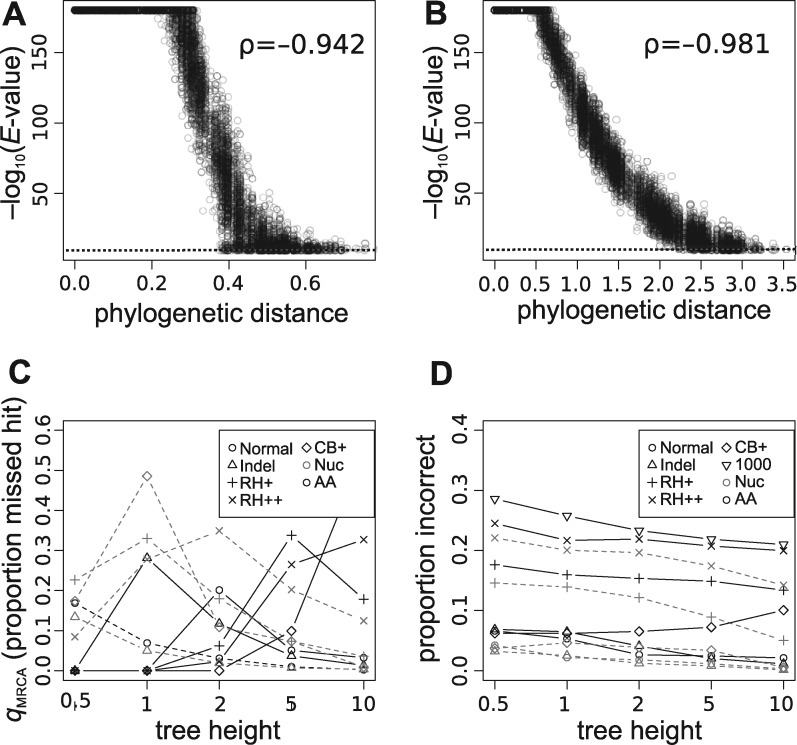
Figure 3.
Correlation of phylogenetic distance and E-values for both (A) nucleotides and (B) amino acid results, shown for tree height of 1 and 10, respectively. The dashed line identifies an E-value cutoff of , and BLAST has an implicit maximum of . Because of the density of points, a random sample of 10 000 points for each plot is shown. Spearman’s rank correlation (ρ) is shown on each plot. See also Supplementary Figure S2. (C) The mean of the (i.e. hits missed among taxa sharing the same MRCA) statistic as calculated across each simulated tree (see Methods for details). (D) Examination of the errors in the first hits. When the first hit is not phylogenetically sister, it is recorded as ‘false’. The proportion of false sister BLAST hits are presented here. Results from BLAST for both nucleotide and amino acids are presented. See also Supplementary Figures S3 and S4.

