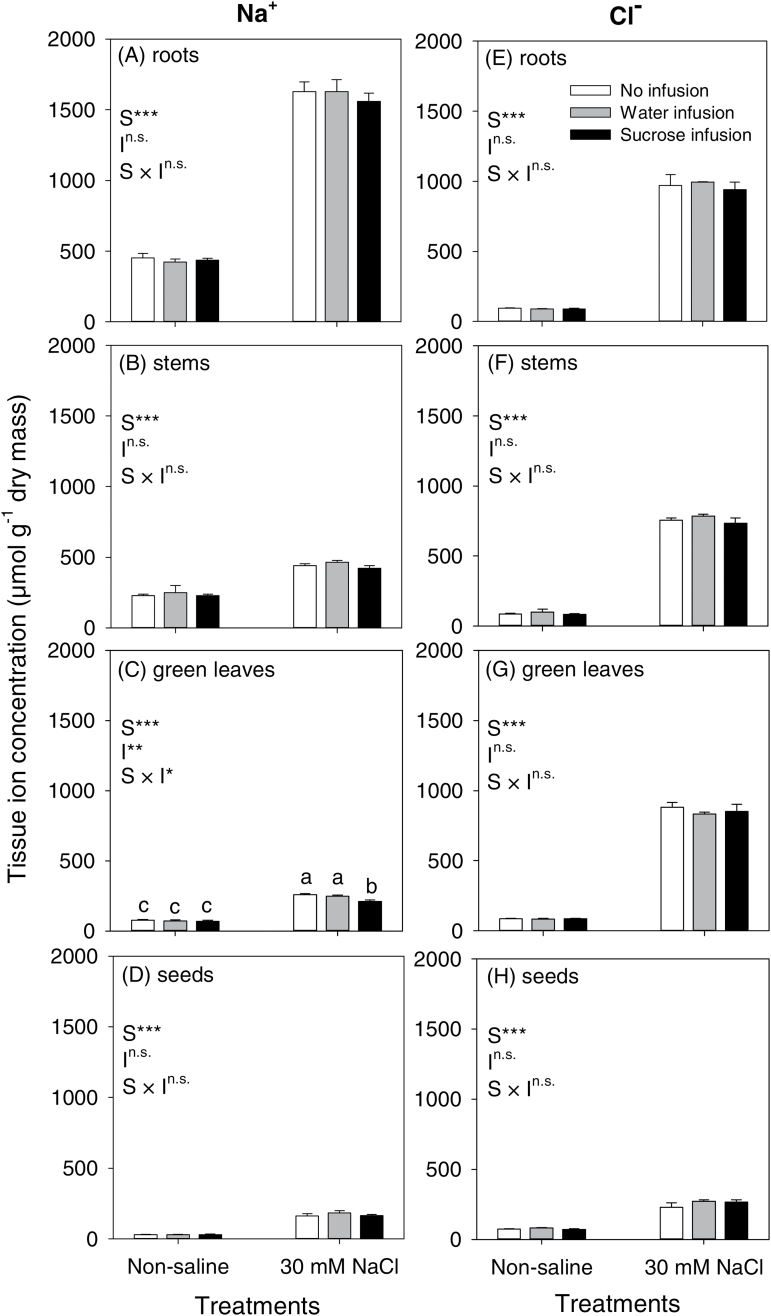
Fig. 5.
Tissue concentrations of Na+ (left column; A–D), and Cl− (right column; E–H) in roots (A, E), stems (B, F), green leaves (C, G) and seeds (D, H) of chickpea (Rupali) subjected to control or 30mM NaCl treatments either without infusion or with stem-infusion with water or 0.44M sucrose (Ψπ=–1.1MPa). Plants were grown in nutrient solution culture and NaCl treatments were imposed on 20-day-old plants for 97 d (20/15±2 °C day/night air temperatures). Infusion treatments were started at the time of flowering (42-day-old plants) and continued until maturity. For measurements of ion concentrations, roots, stems and leaves were harvested after 28 d of infusion whereas seeds were harvested at maturity. Values are means±SE (n=4). Two-way ANOVA was used to compare salt (S), infusion (I) and salt × infusion interaction (S × I) effects (***, significant with P<0.001; **, significant with P<0.01; *, significant with P<0.05; n.s., not significant with P>0.05). Significant differences (salt × infusion interaction at P=0.05) were only observed for Na+ in leaves, which are indicated by different letters for each mean within each panel.

