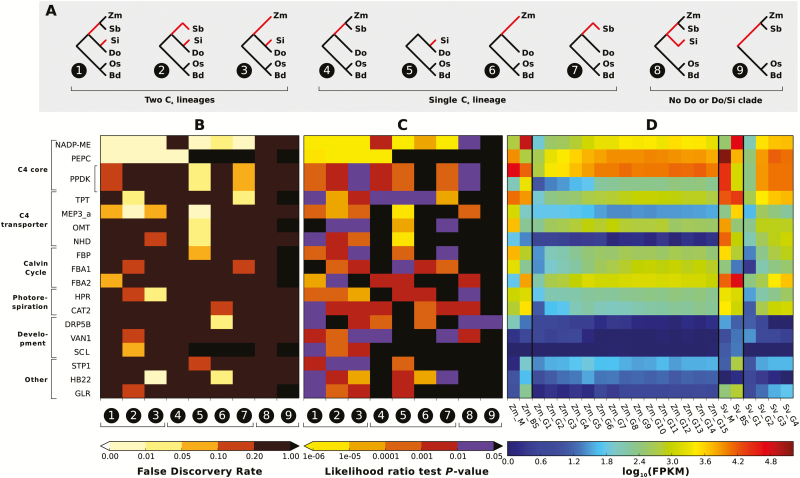
Fig. 1.
Phylogenies used for selection scan, statistical significance and tissue-specific expression data for top 18 candidate C4 ortholog groups. (A) Nine phylogenetic conditions used for selection scan. Red branches are branches where the C3 to C4 transitions are inferred to have occurred (C4 branches). Zm: maize; Sb: sorghum; Si: S. italica; Do: D. oligosanthes; Os: rice; Bd: B. distachyon. (B) False discovery rates from selection scan. Each column represents tests under the same phylogenetic condition corresponding to (A), and each row (or two rows in the case of maize, which has two homeologs) represent one ortholog group. Lighter color indicates higher significance. Ortholog groups are grouped according to their functional relevance to C4, specified on the left. (C) P-values of likelihood ratio tests from selection scan. These are single test statistics and not multi-tests corrected. (D) Tissue specific expression profile of corresponding ortholog groups in maize and Setaria, shown on log scale. Zm_M/BS: maize mesophyll/bundle sheath; Zm_G1-15: maize leaf gradient. Sv_M/BS: Setaria viridis mesophyll/bundle sheath; Sv_G1-4: S. viridis leaf gradient. The BS/M original data are downloaded from John et al. (2014) and were originally generated by John et al. (2014) and Chang et al. (2012). The maize leaf gradient data are obtained from Wang et al. (2014a). The S. viridis gradient data are obtained from (A. J. Studer, J. C. Schnable, S. Weissmann et al., unpublished data).

