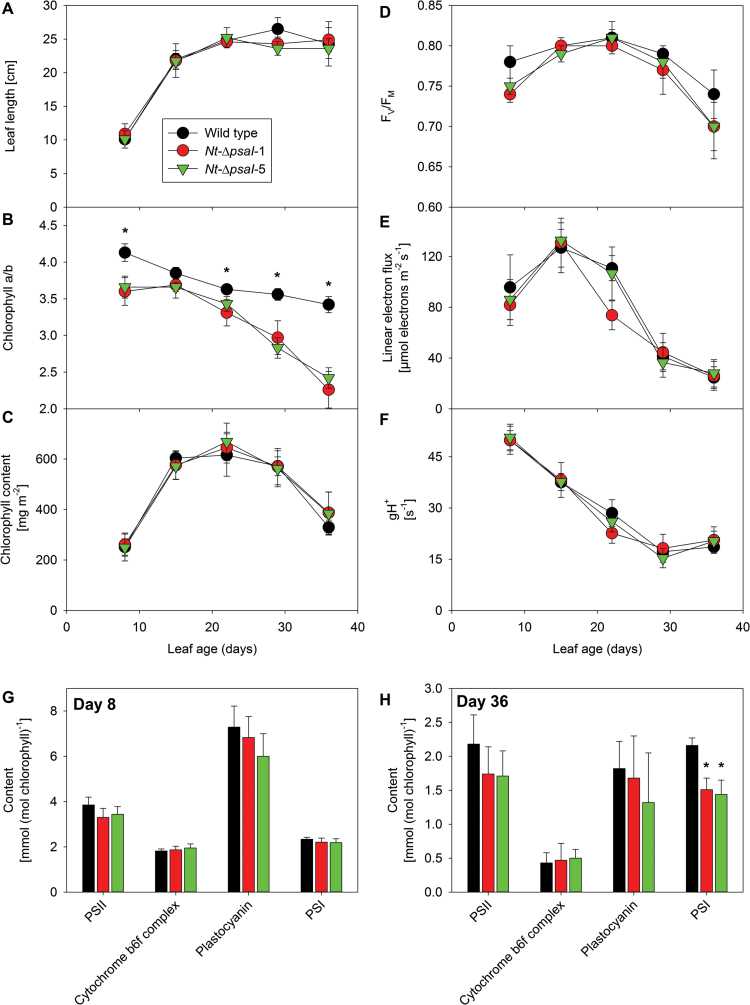
Fig. 10.
Changes in photosynthetic parameters during leaf ontogenesis. (A) Leaf length. (B) Chlorophyll a/b ratio. (C) Chlorophyll concentration. (D) Maximum quantum efficiency of PSII in the dark-adapted state (FV/FM). (E) Linear electron flux (corrected for leaf absorptance). (F) ATP synthase activity (gH+). (G) Photosynthetic complex accumulation per chlorophyll in young leaves (8 days old). (H) Photosynthetic complex accumulation per chlorophyll in senescing leaves (36 days old). Data are the averages of a minimum of six biological replicates from three independent plant cultures, and the standard deviation is shown. The asterisks indicate significant differences between wild type and mutants.

